I see 2 D's and 3 R's. Which star did what and when, is not entirely clear to me yet. I'm hoping that piecing together with Kirk's and Karl's binary star re-analysis may help.
First analysis - (not the solution settled upon, see "Reanalysis" below, and also the linked double star analysis separate page below)
I used my original csv file. The process is:
* Trim left/right to maximize the two durations that isolate your chosen event.
* Use the "interval" method, not max/min points! Highlight the interval within which is your D or R
* Click "find event". For me, it found the event very quickly.
* Copy/paste the timings and confidence intervals to somewhere you can mail them to me
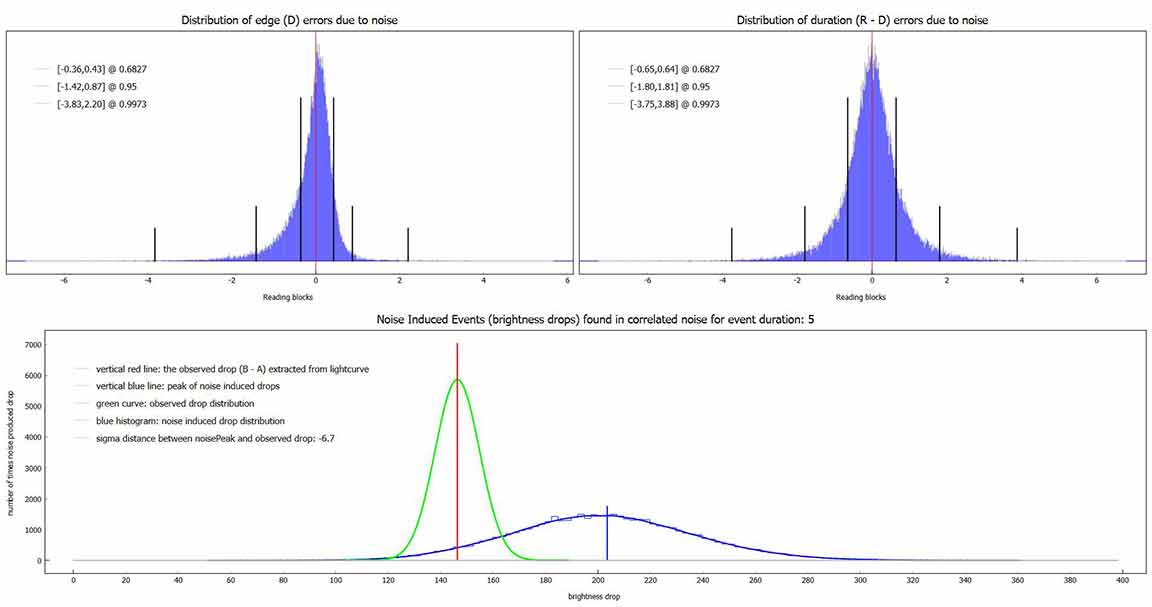
* Copy/paste the histogram of the NIE test likewise.
* Depending on what you get, you will then want to fill out multiple IOTA forms. If you clearly have just 2 D's and 2 R's, I would pair them D1+R1 and D2+R2. I have not seen instructions to do otherwise. It will be up to the reviewers to make sense of what star disappeared and reappeared at what event.
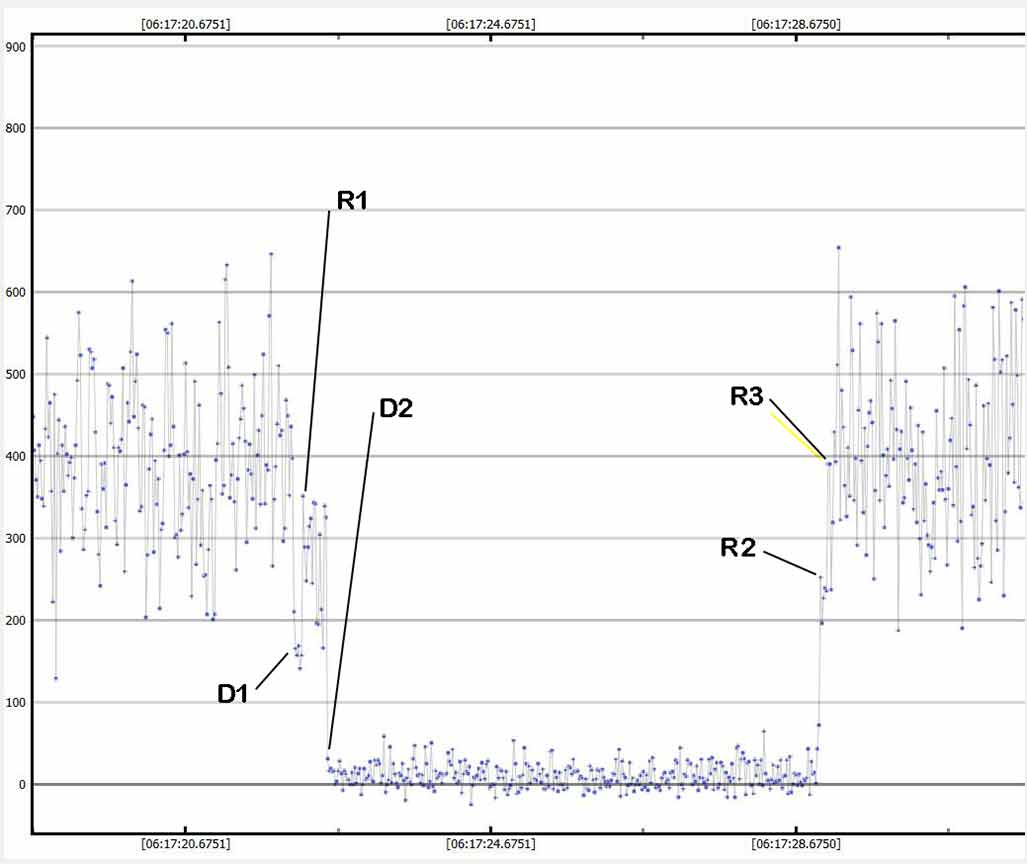
For my event below, I see 2 D's and 3 R's. It's hard to interpret. Depending on what others of this event come up with, maybe we (or Dave Gault??) can make sense of which star did what.
I see 2 D's and 3 R's. Which star did what and when, is not entirely clear to me yet. I'm hoping that piecing together with Kirk's and Karl's binary star re-analysis may help. |
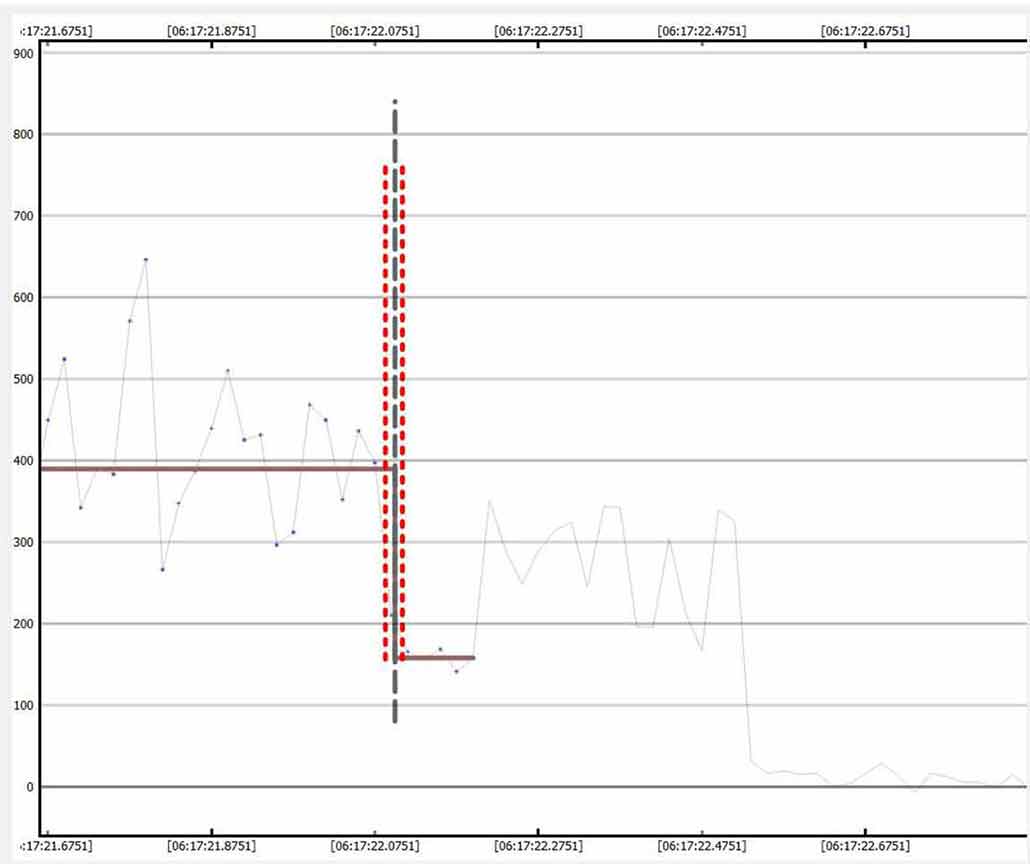
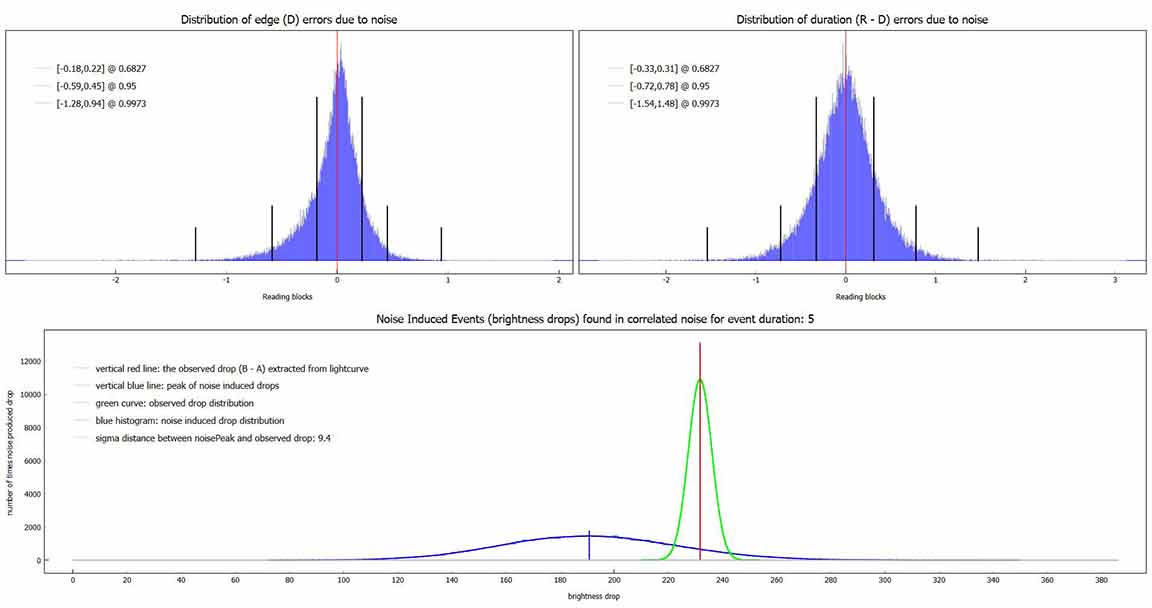
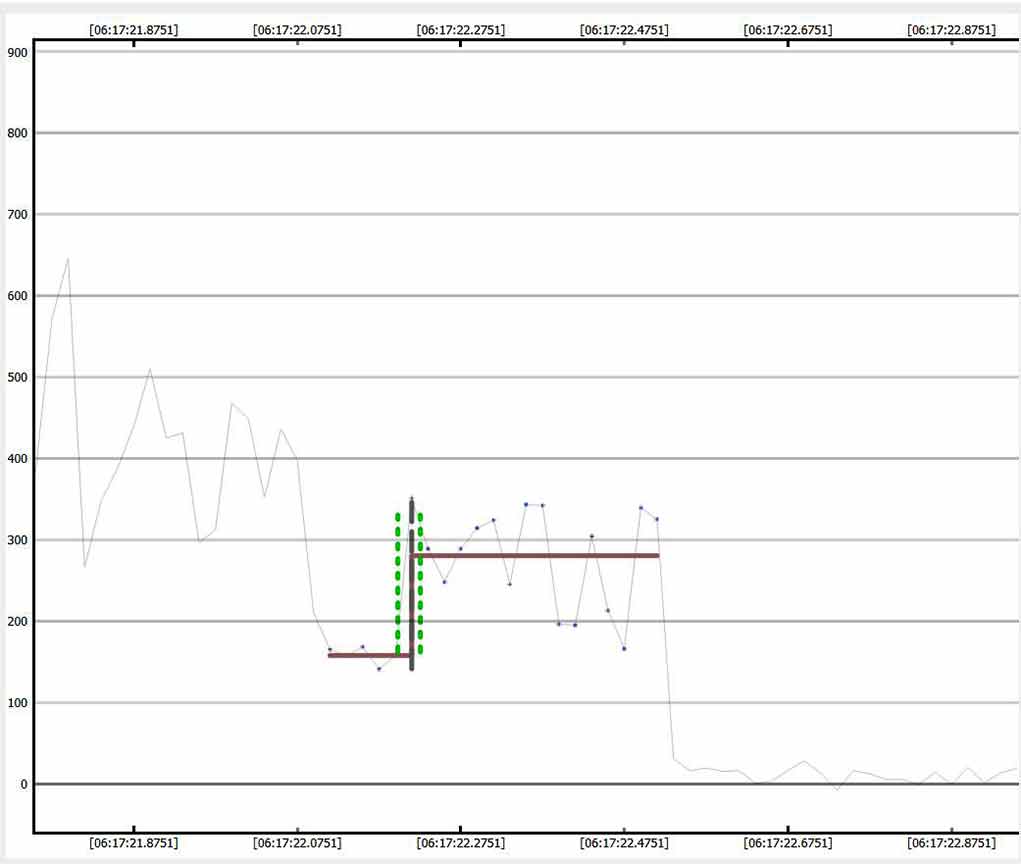
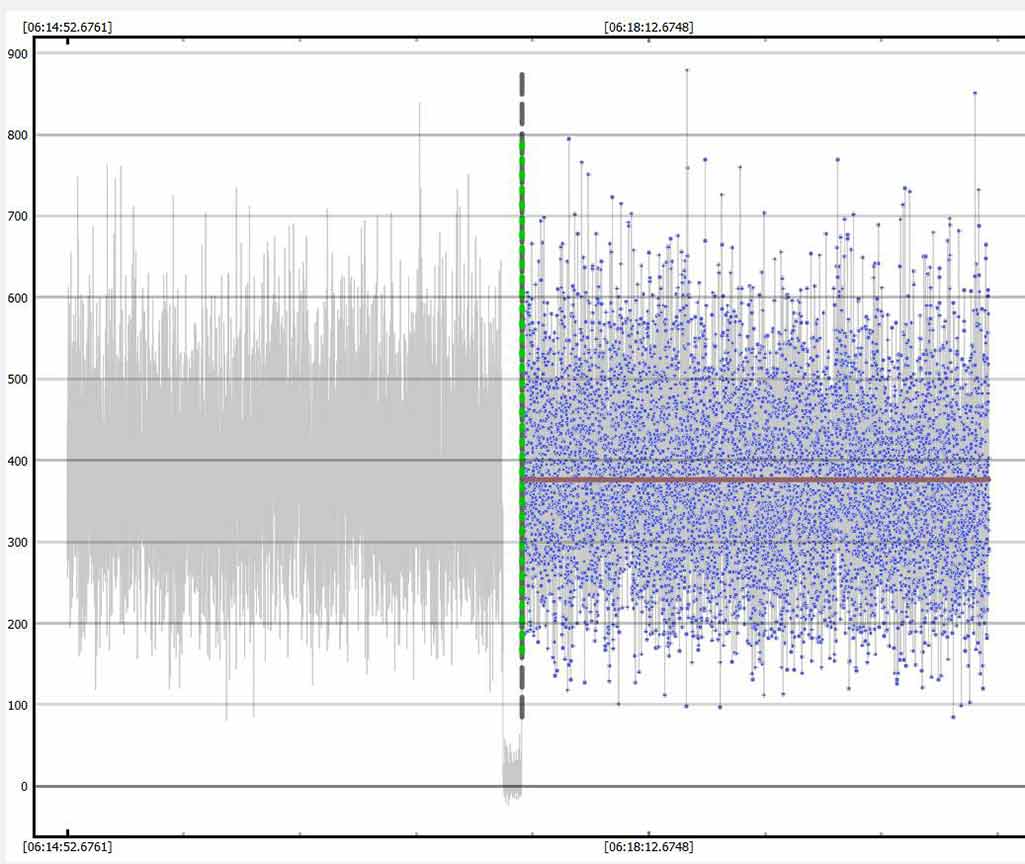
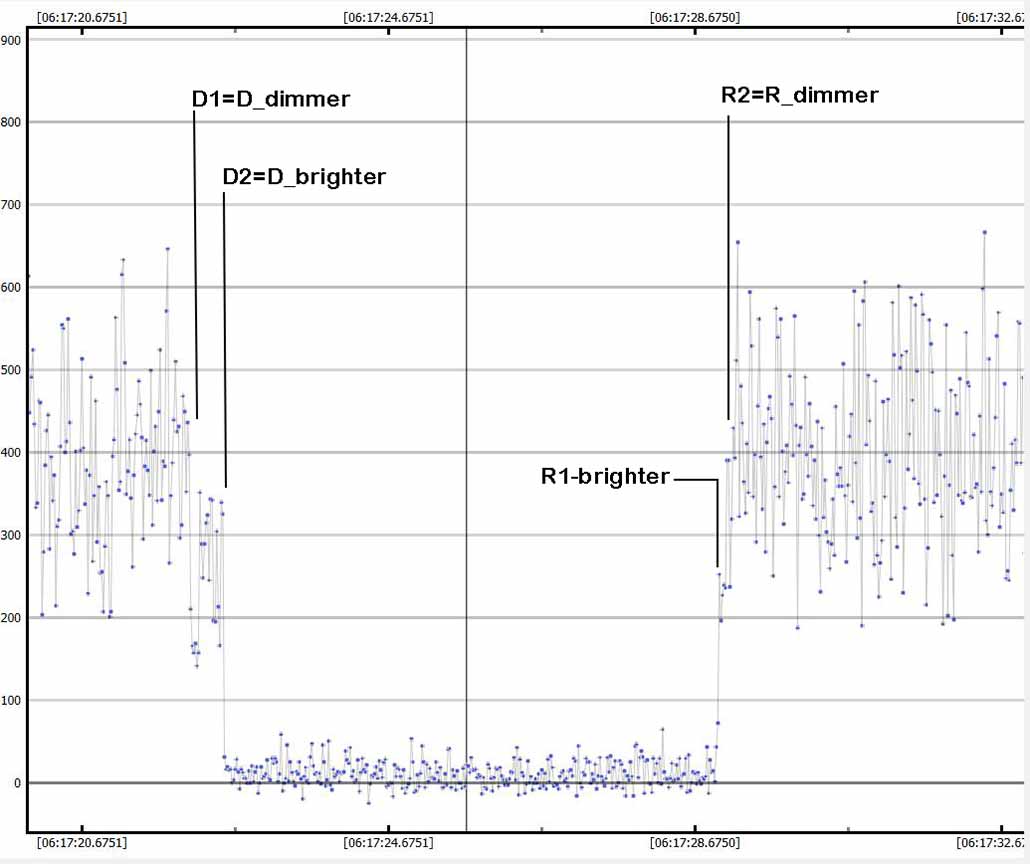
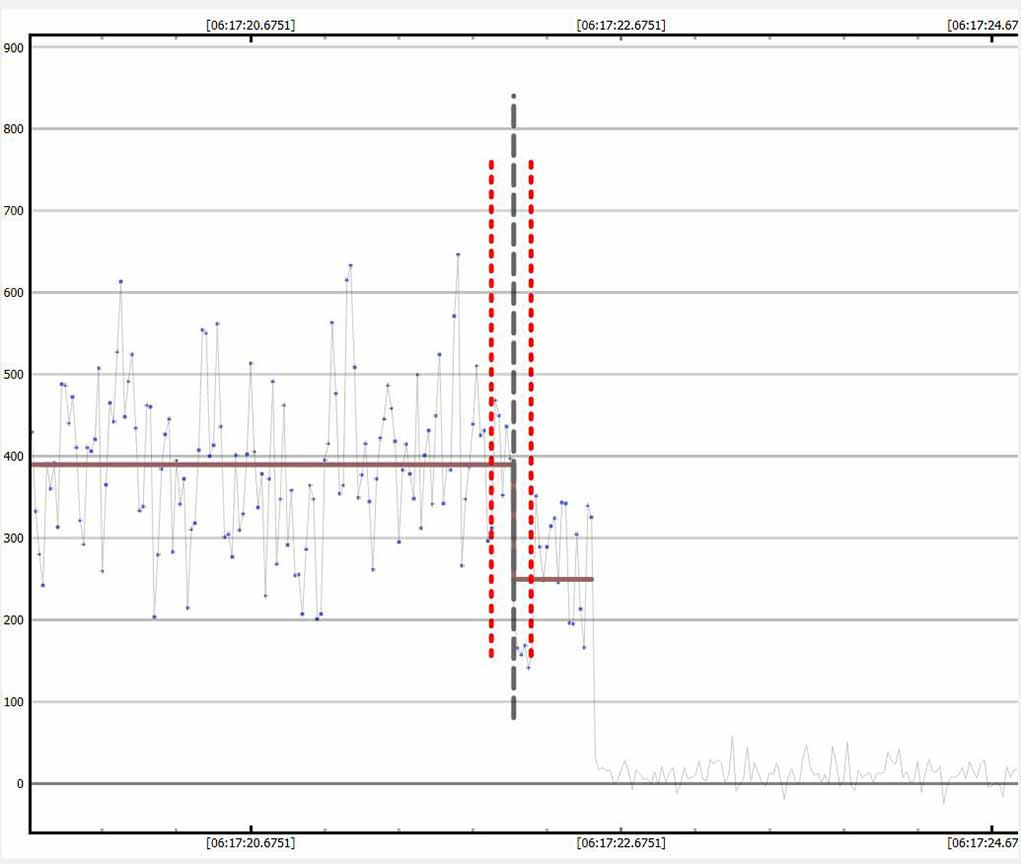
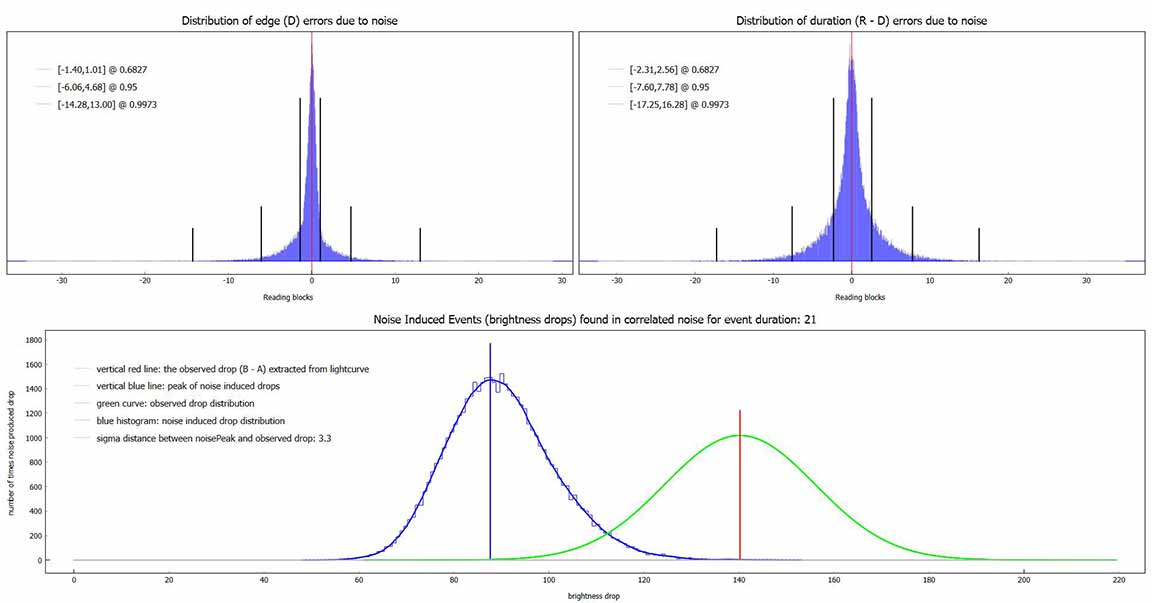
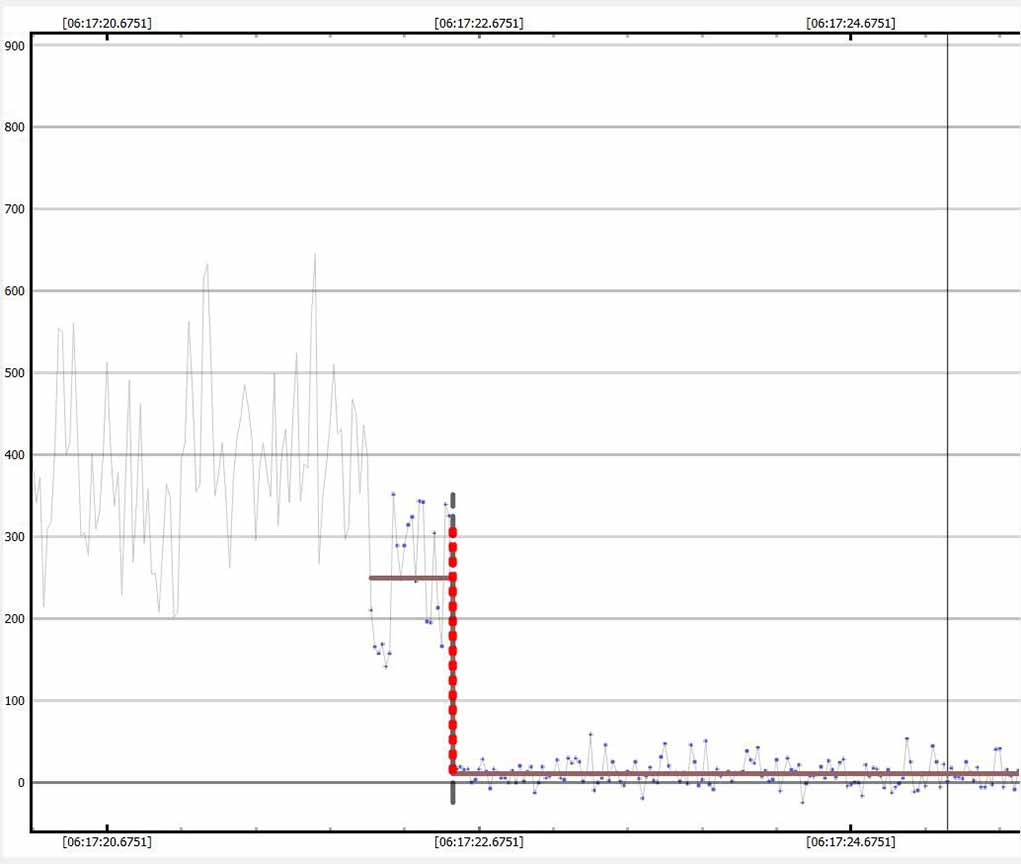
This event is unusual looking. It drops and stayed dropped by 60% (to level=166) for 6 data points, then brightened back to almost but not quite full brightness, for 16 data points to level=285, then disappeared entirely. This first D is taken as the first drop by 36% of total light. The return upward a fraction of a second later may be a 'graze' event, and the return brightness should be interpreted as "full brightness". Or it may be interpretted as still one star is gone and the bounce upward should be ignored as noise. But it doesn't really look like noise, it looks real and NIE says it's very likely real. Could one star be on a grazing path? But then it should not stay gone for then a long period equivalent to the predicted event duration. I will simply determine what seem to be the D's and R's here. Starting with D1...
magDrop report: percentDrop: 59.5 magDrop: 0.982 +/- 0.067 (0.95 ci)
DNR: 2.41
D time: [06:17:22.0996]
D: 0.6800 containment intervals: {+/- 0.0045} seconds
D: 0.9500 containment intervals: {+/- 0.0118} seconds
D: 0.9973 containment intervals: {+/- 0.0256} seconds
 |
 |
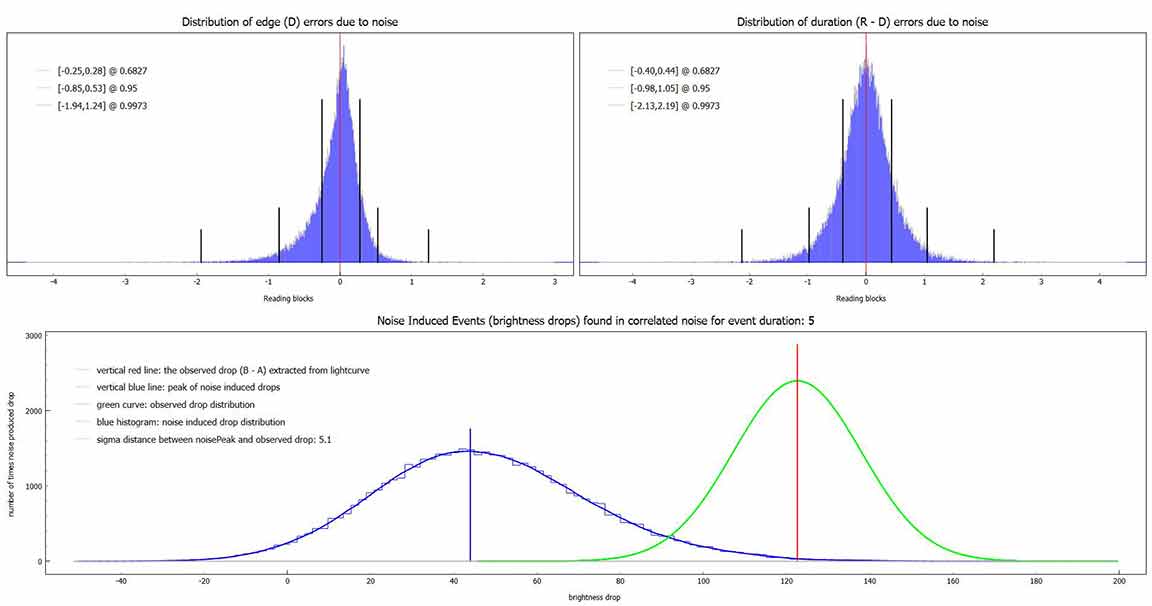
After staying at level 166 for 6 data points, the light curve rose to 280 average for another 16 integrations. The boundary between these I'm labelling as R2. It's hard to interpret physically. A graze doesn't make sense, not when the vast majority of the entire occulted light curve is very close to zero. But, here's the R1 event I found in PyOTE
magDrop report: percentDrop: 43.8 magDrop: 0.625 +/- 0.132 (0.95 ci)
DNR: 2.07
R time: [06:17:22.2151]
R: 0.6800 containment intervals: {+/- 0.0055} seconds
R: 0.9500 containment intervals: {+/- 0.0170} seconds
R: 0.9973 containment intervals: {+/- 0.0388} seconds
 |
 |
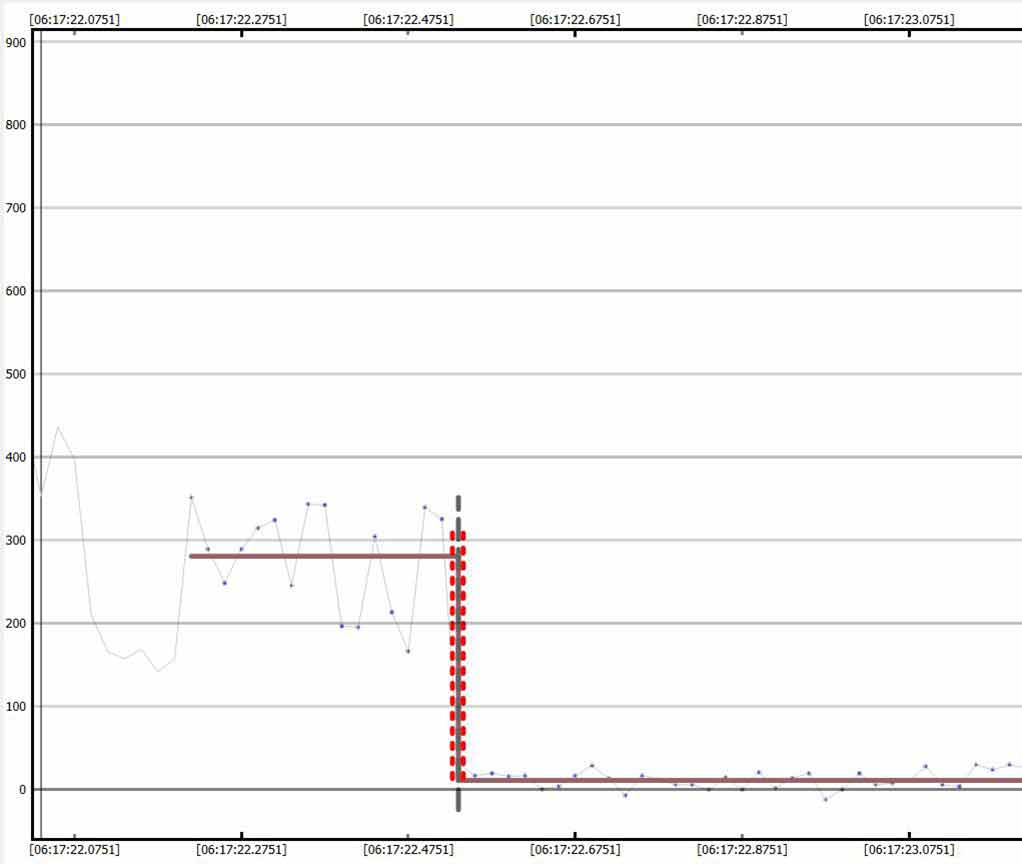
I took this D2 trim from the recovery to near full brightness, to the full drop to zero and most of the way across the long full disappearance. PyOTE took the D time as when the star(s) were fully gone.
magDrop report: percentDrop: 96.3 magDrop: 3.591 +/- 0.210 (0.95 ci)
DNR: 4.55
D time: [06:17:22.5351]
D: 0.6800 containment intervals: {+/- 0.0028} seconds
D: 0.9500 containment intervals: {+/- 0.0072} seconds
D: 0.9973 containment intervals: {+/- 0.0133} seconds
 |
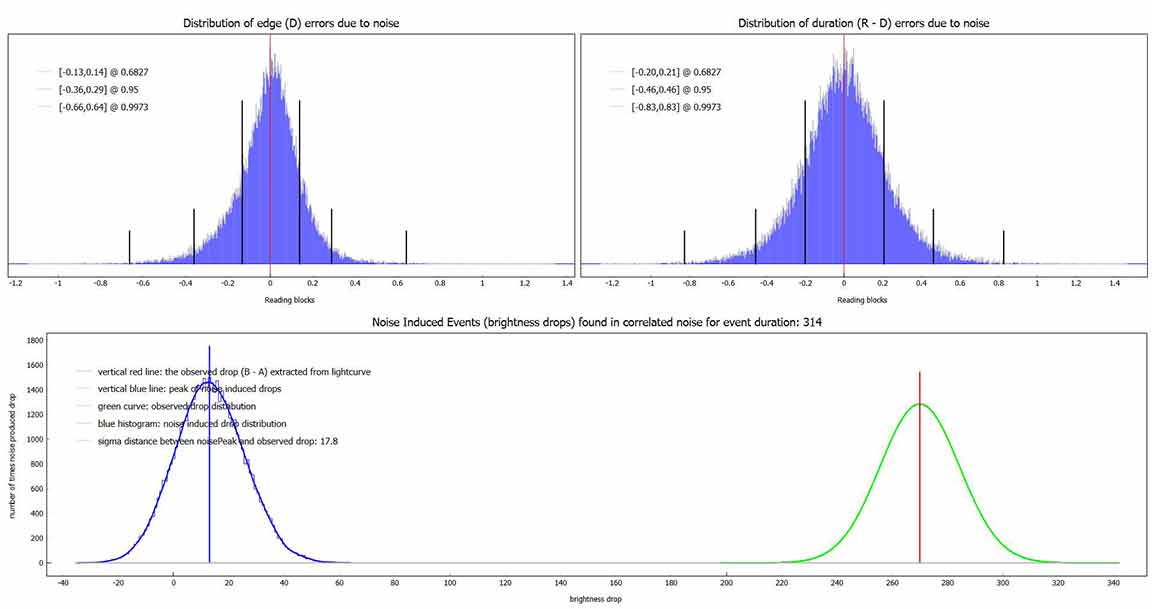 |
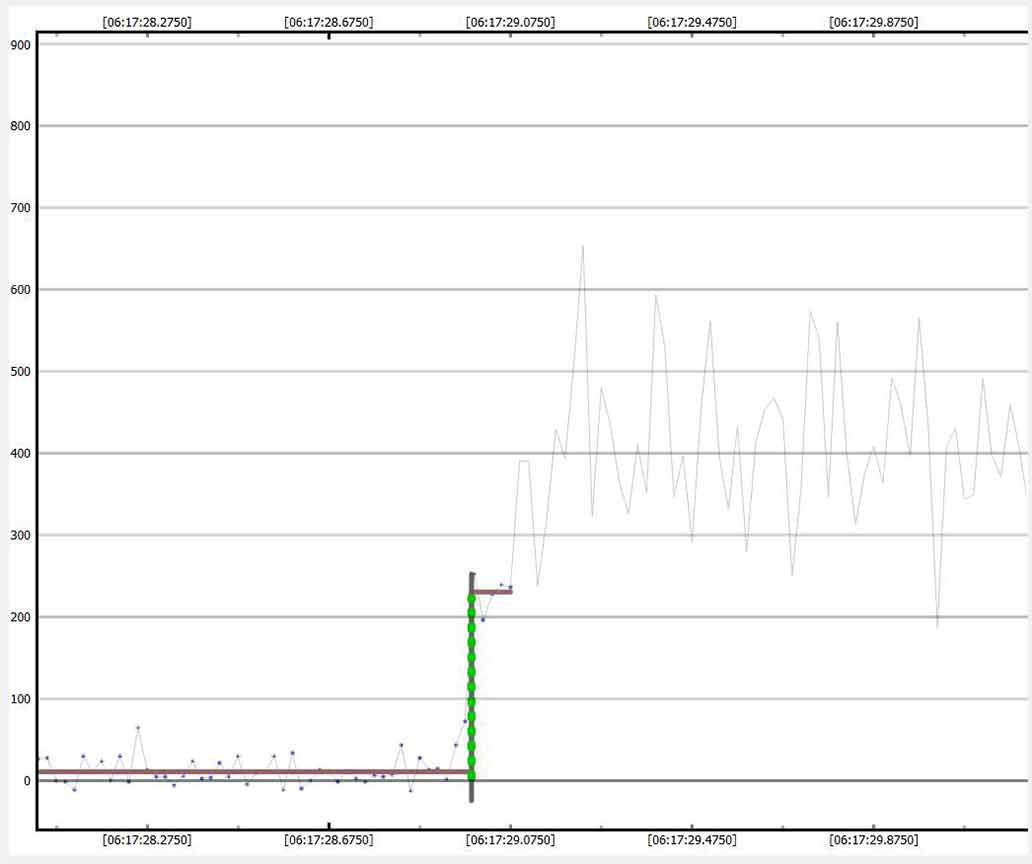
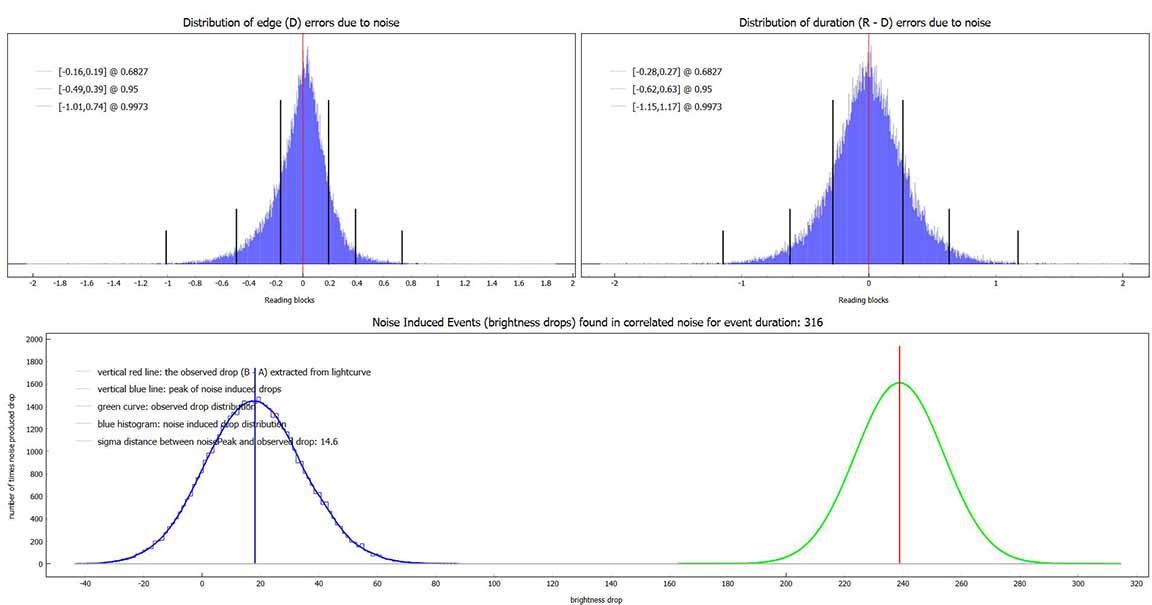
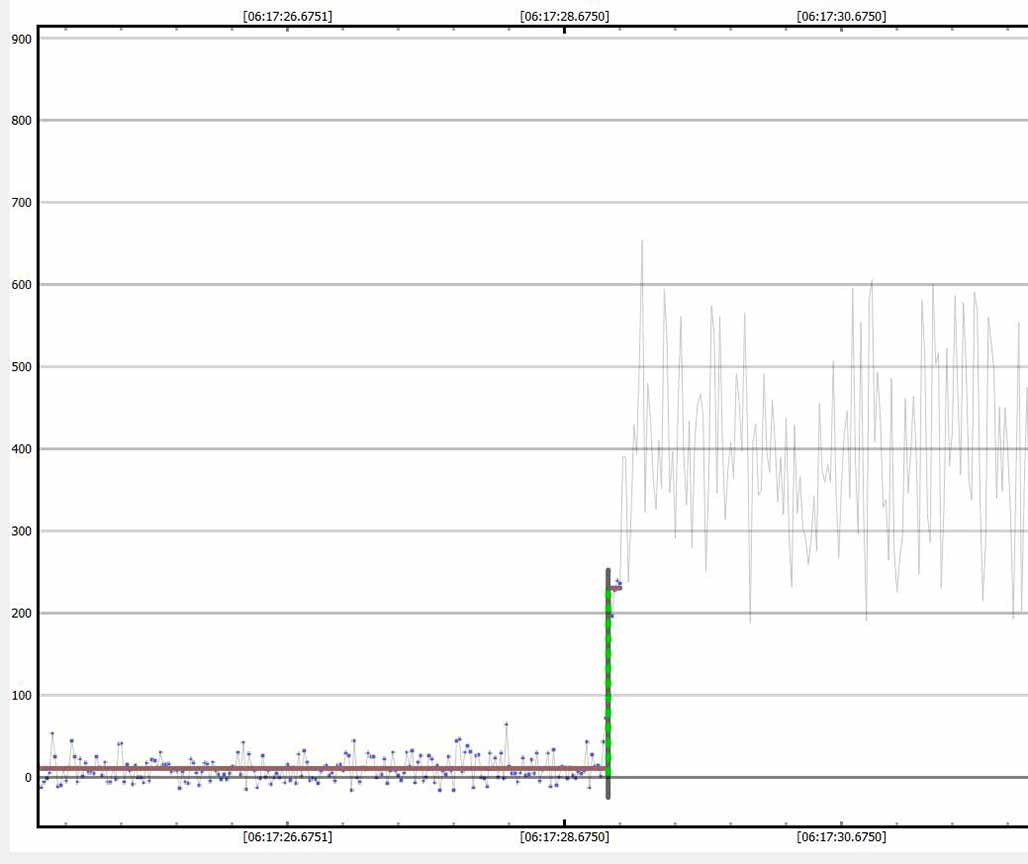
The first of two closely spaced reapparances. There is no "graze look" to these R's; no intermediate D.
magDrop report: percentDrop: 95.5 magDrop: 3.367 +/- 0.196 (0.95 ci)
DNR: 11.69
R time: [06:17:28.9894]
R: 0.6800 containment intervals: {+/- 0.0016} seconds
R: 0.9500 containment intervals: {+/- 0.0034} seconds
R: 0.9973 containment intervals: {+/- 0.0069} seconds
 |
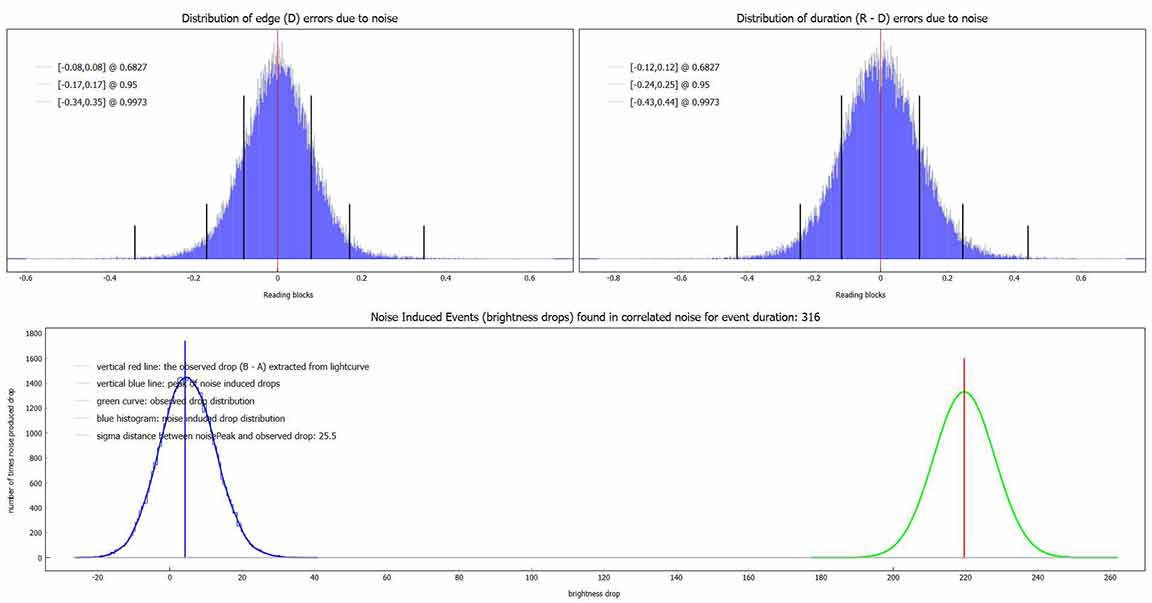 |
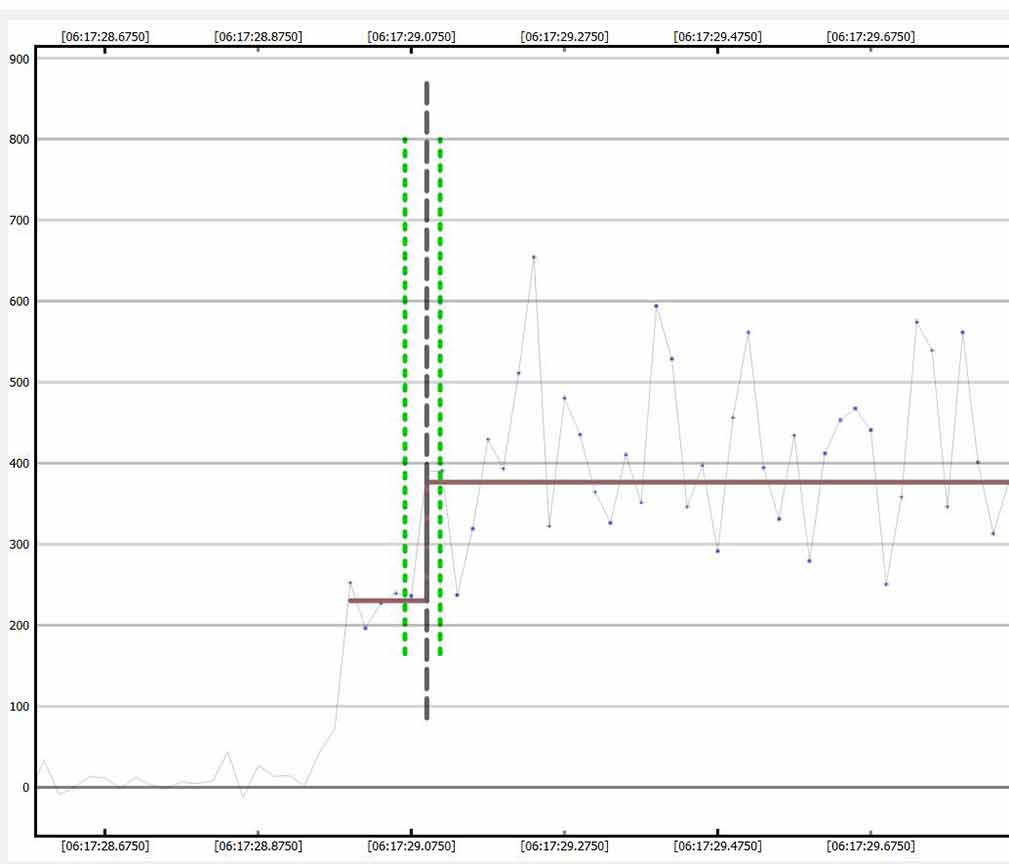
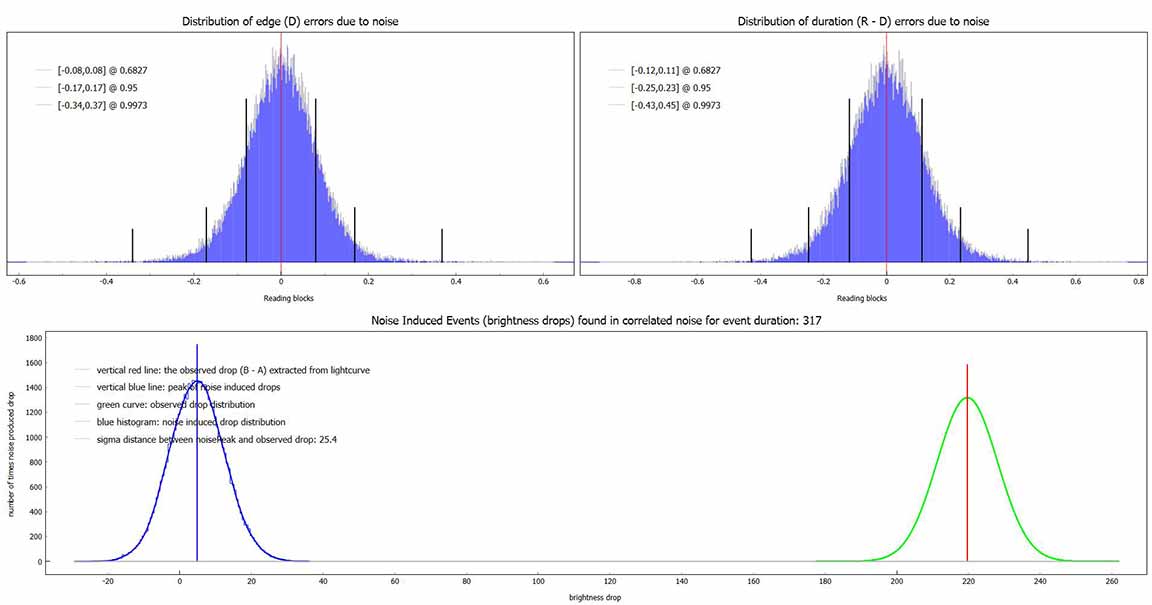
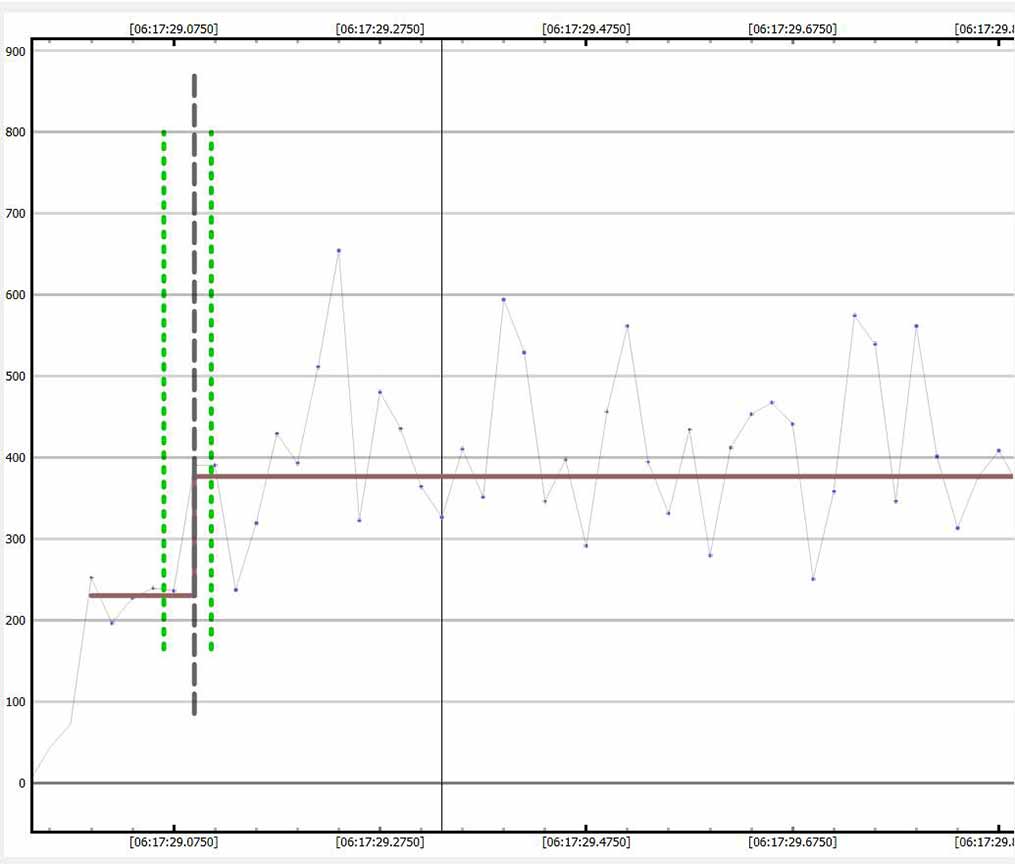
The second of two closely spaced reapparances. Again, no "graze" look to these R's.
magDrop report: percentDrop: 38.9 magDrop: 0.535 +/- 0.080 (0.95 ci)
DNR: 1.41
R time: [06:17:29.0950]
R: 0.6800 containment intervals: {+/- 0.0085} seconds
R: 0.9500 containment intervals: {+/- 0.0284} seconds
R: 0.9973 containment intervals: {+/- 0.0767} seconds
 |
 |
 |
================================================================================================================================
Now combining these and Kirk's and Karl's, it just cannot make sense that the target "blinked" at the D and then came back partially. Short D/R's like this are a feature of grazing incidence. Yet that would be highly likely to yield a short event for the grazing star. Instead, both stars were gone for a proper ~6 s long - the full diameter just as the high rank prediction would be expected to give. Yet on the other hand, the "blink" had 6 consecutive points that were low before rising to the "shelf" which was even longer, then final D, so it looked real, and NIE said it was very likely real. But, the logic says it just can't be real.
Then I noticed that combining the "blink" and shelf levels as if they were really at the same true level, you get an average that matches the recovery partial R level, so I think the least unlikely interpretation is that the "R1" above should be removed and instead we just had a random improbable series of low points and then high points around the same true average. It might also be the result, at least in part, of a Fresnel diffraction wave.
So, I'm re-submitting my results now as just 2 IOTA reports, as the dimmer star disappeared first, and reappeared last. The brighter star had the shorter chord. So, here is my final report timings:
 |
magDrop report: percentDrop: 36.0 magDrop: 0.485 +/- 0.141 (0.95 ci)
DNR: 1.46
D time: [06:17:22.0951]
D: 0.6800 containment intervals: {+/- 0.0280} seconds
D: 0.9500 containment intervals: {+/- 0.1212} seconds
D: 0.9973 containment intervals: {+/- 0.2856} seconds
 |
 |
magDrop report: percentDrop: 95.9 magDrop: 3.460 +/- 0.222 (0.95 ci)
DNR: 3.30
D time: [06:17:22.5351]
D: 0.6800 containment intervals: {+/- 0.0038} seconds
D: 0.9500 containment intervals: {+/- 0.0098} seconds
D: 0.9973 containment intervals: {+/- 0.0202} seconds
 |
 |
magDrop report: percentDrop: 95.5 magDrop: 3.369 +/- 0.196 (0.95 ci)
DNR: 11.69
R time: [06:17:28.9894]
R: 0.6800 containment intervals: {+/- 0.0016} seconds
R: 0.9500 containment intervals: {+/- 0.0034} seconds
R: 0.9973 containment intervals: {+/- 0.0071} seconds
 |
 |
magDrop report: percentDrop: 38.9 magDrop: 0.535 +/- 0.080 (0.95 ci)
DNR: 1.41
R time: [06:17:29.0950]
R: 0.6800 containment intervals: {+/- 0.0087} seconds
R: 0.9500 containment intervals: {+/- 0.0296} seconds
R: 0.9973 containment intervals: {+/- 0.0751} seconds
 |
 |
I took his revised csv file, in which he used a tighter mask, and we saw a clearer D1 and D2, and I did the run-through in PyOTE
magDrop report: percentDrop: 79.9 magDrop: 1.744 +/- 0.284 (0.95 ci)
DNR: 9.35
D time: [06:17:21.7658]
D: 0.6800 containment intervals: {+/- 0.0037} seconds
D: 0.9500 containment intervals: {+/- 0.0082} seconds
D: 0.9973 containment intervals: {+/- 0.0171} seconds
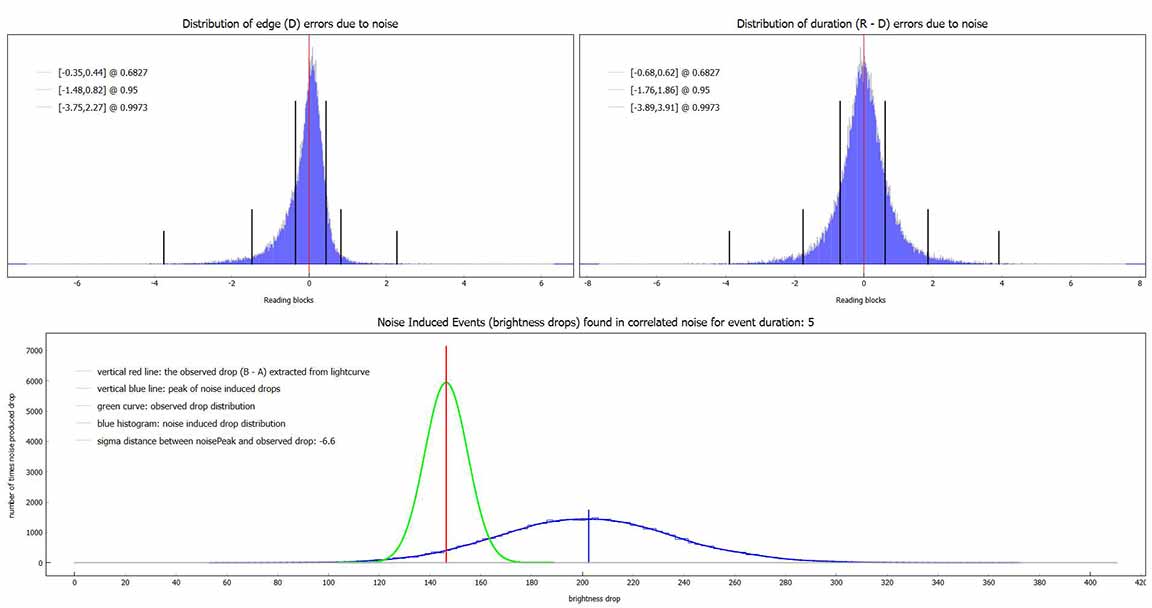
And for D2 and main occultation till R. There's no evident step in the R, as there was for Kirk and I. However, Karl's light curve is filled with noisy drop out which I'm trying to understand better before giving my interpretation of this data.
magDrop report: percentDrop: 94.8 magDrop: 3.217 +/- 0.299 (0.95 ci)
DNR: 4.92
D time: [06:17:22.2374]
D: 0.6800 containment intervals: {+/- 0.0043} seconds
D: 0.9500 containment intervals: {+/- 0.0103} seconds
D: 0.9973 containment intervals: {+/- 0.0198} seconds
R time: [06:17:27.9238]
R: 0.6800 containment intervals: {+/- 0.0043} seconds
R: 0.9500 containment intervals: {+/- 0.0103} seconds
R: 0.9973 containment intervals: {+/- 0.0198} seconds
Duration (R - D): 5.6864 seconds
Duration: 0.6800 containment intervals: {+/- 0.0062} seconds
Duration: 0.9500 containment intervals: {+/- 0.0137} seconds
Duration: 0.9973 containment intervals: {+/- 0.0240} seconds
==================================================================================
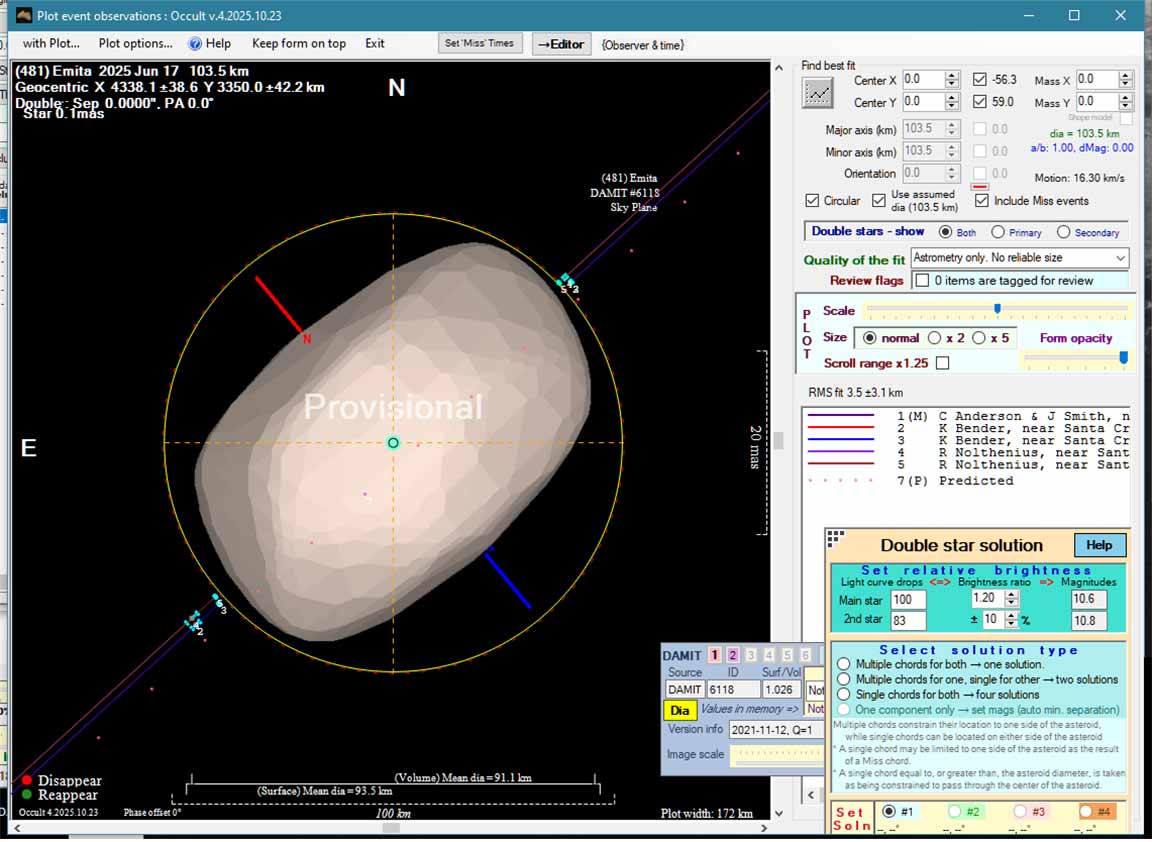
Dave Gault kindly ran this through his OCCULT4 analysis, incorporating the DAMIT photometry model, for this preliminary solution which does not yet include Karl von Ahnen's timings |
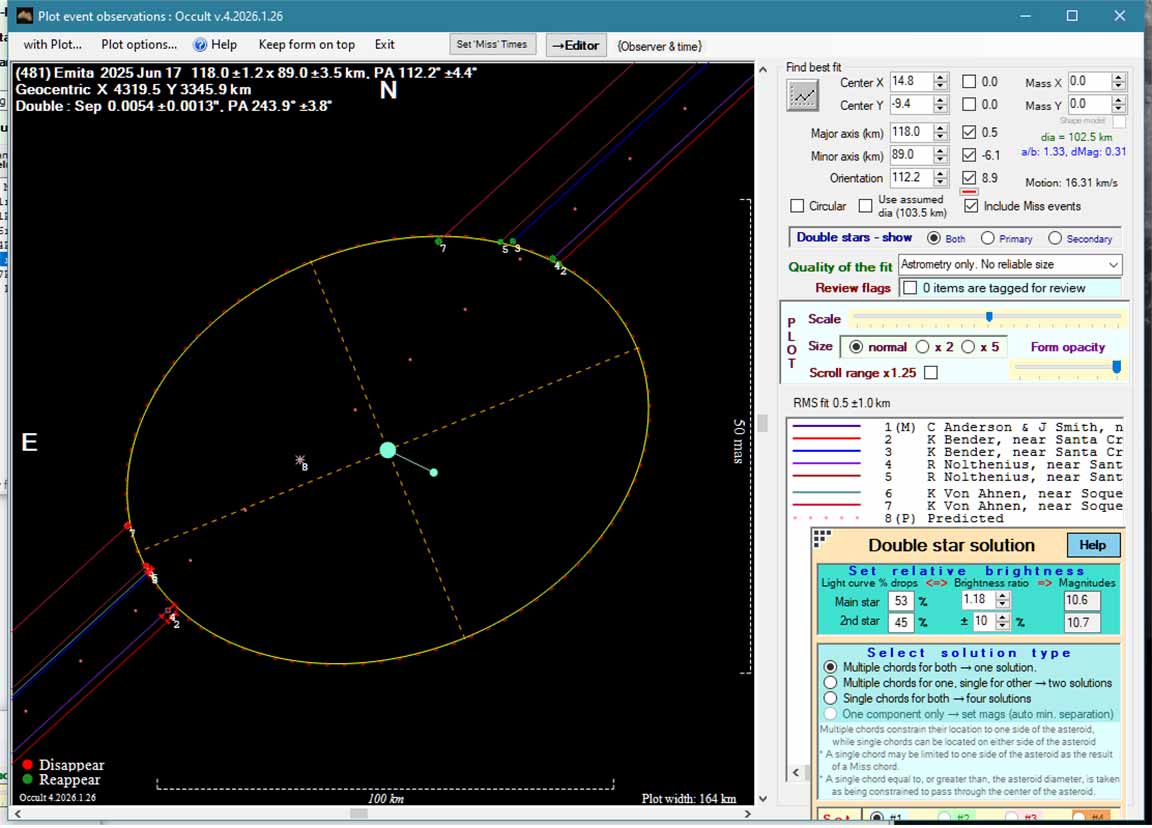
Now including Karl's light curve data, on Feb 1, 2026 Dave Gault sent this... |