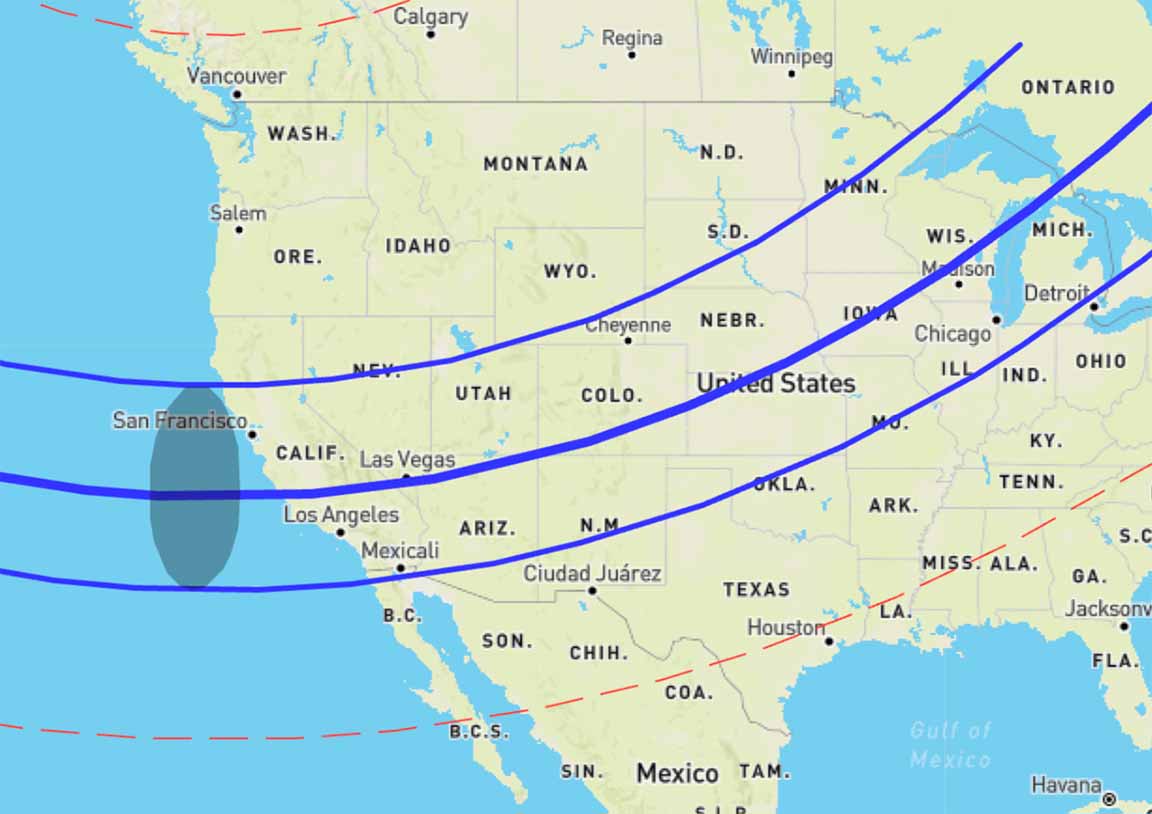
This is a high value event with 9 other observers signed up for it. The path includes all of California
Very faint at RP=15.3, but might be recordable at 2.2s 128x integrations? Or 5s 256x integrations on my PAL Watec? At 256x we would have up to 3 points inside the occultation. It's more suited to the larger 12" at Cabrillo, but the altitude is too low to get from Cabrillo I fear. And inside the marine layer too. RUWE=0.95 which is good. At our location they predict a 14.4s event. The G magnitude is 16.2 but the RP mag is brighter at 15.3, a rather red star, so we might get lucky there. The path is very wide, so it hardly matters where you set up, as long as you're above the fog.
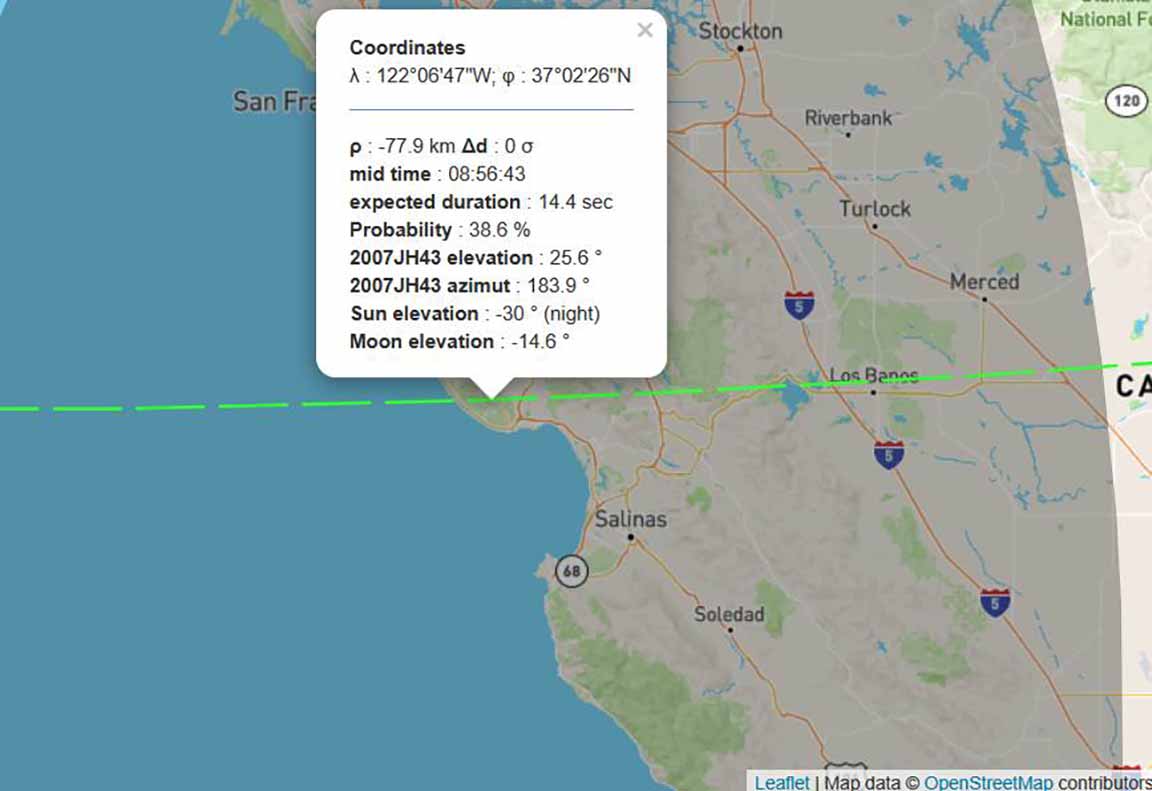
The odds of a "hit" are not bad for a KBO. 39%, we're near the centerline.
Alt=25.6 Az=184 in Scorpius, 10 degrees due left of Antares
The weather is improving. The marine layer is almost disappeared now (ZoomEarth) and Ft Ord Profiler. We should have clear skies anywhere we try.
J2000
RA=17h 07 08.96s
Dec=-27 22 29.48"
Of Date
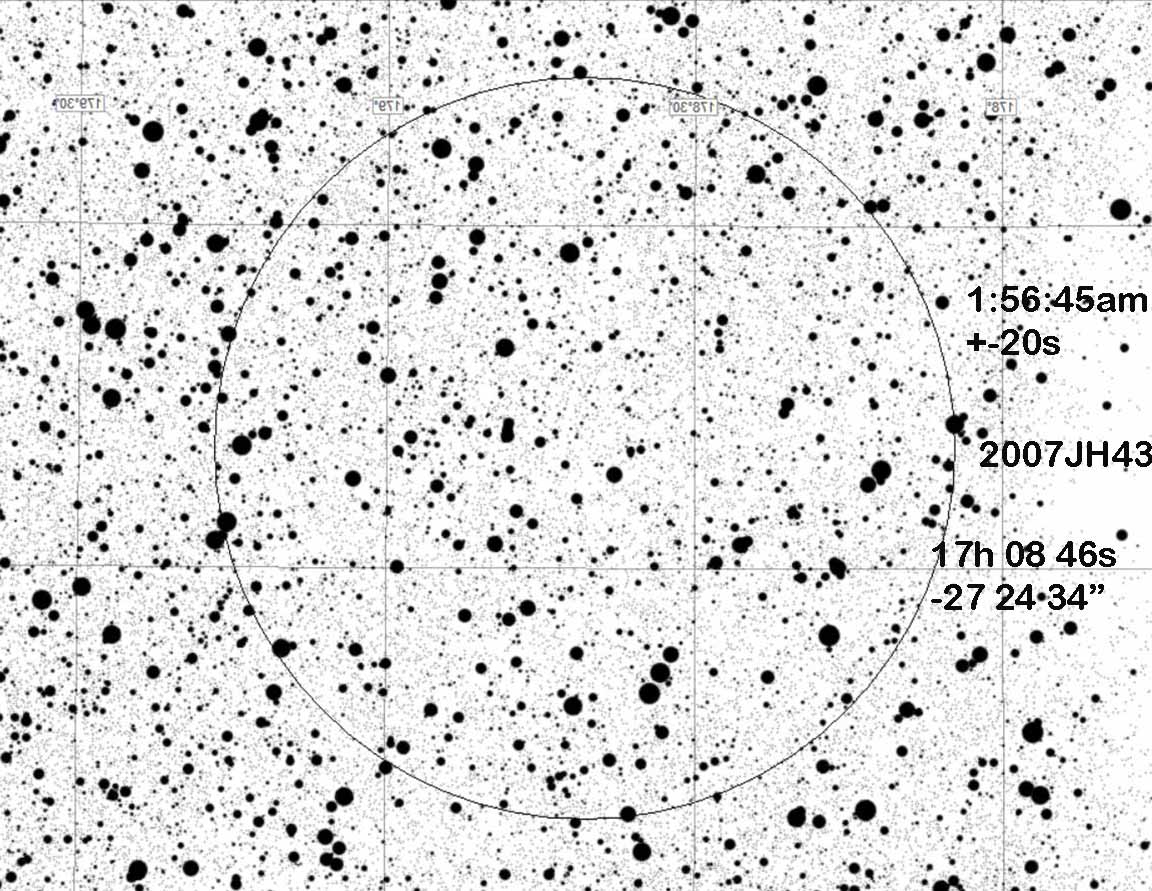
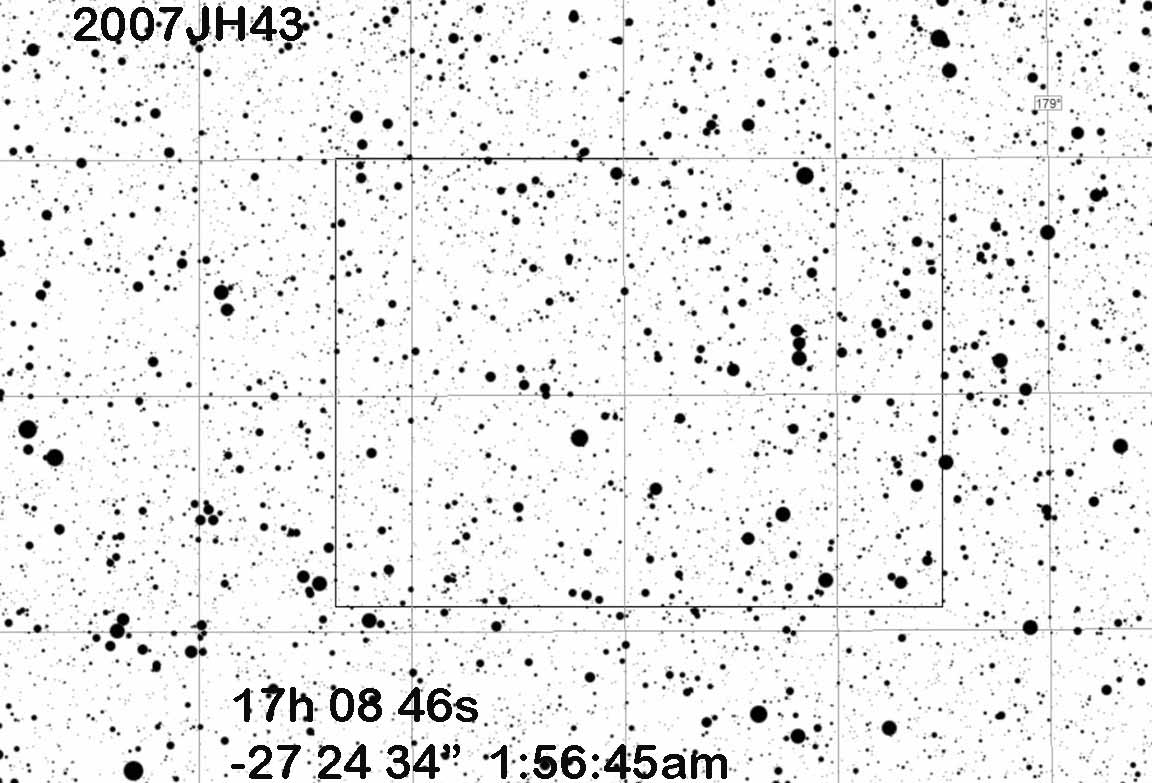
RA= 17h 08 46s
Dec=-27 24 34"
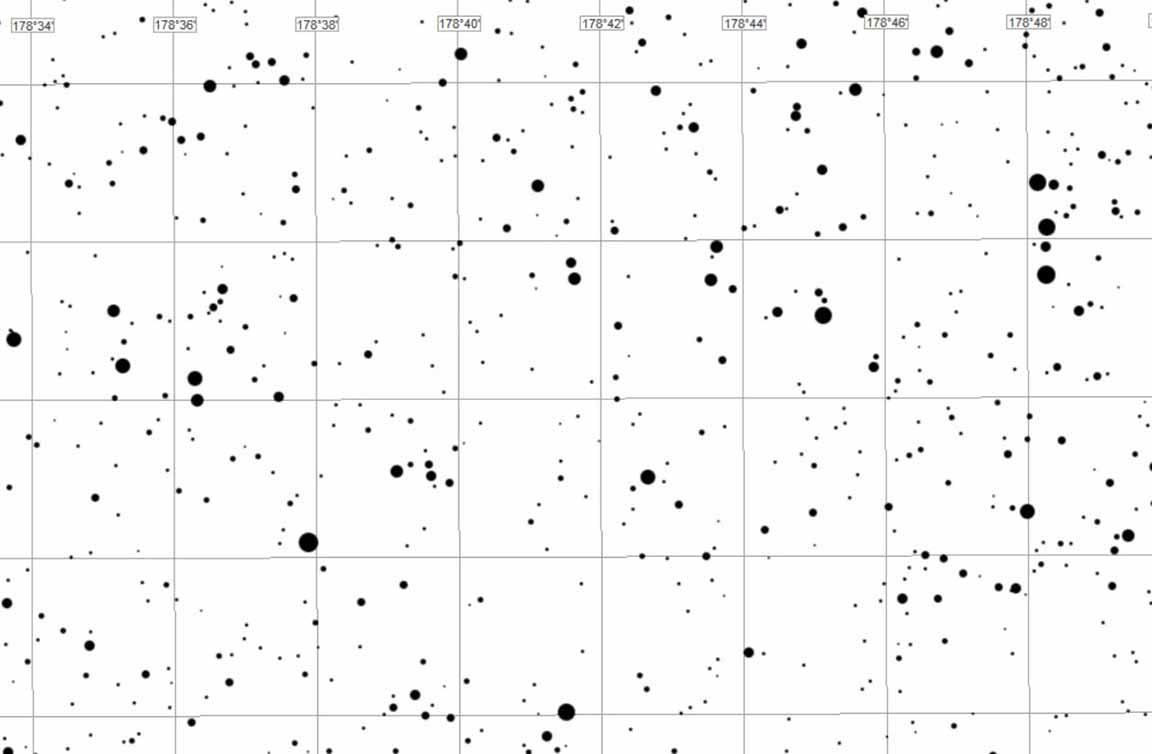
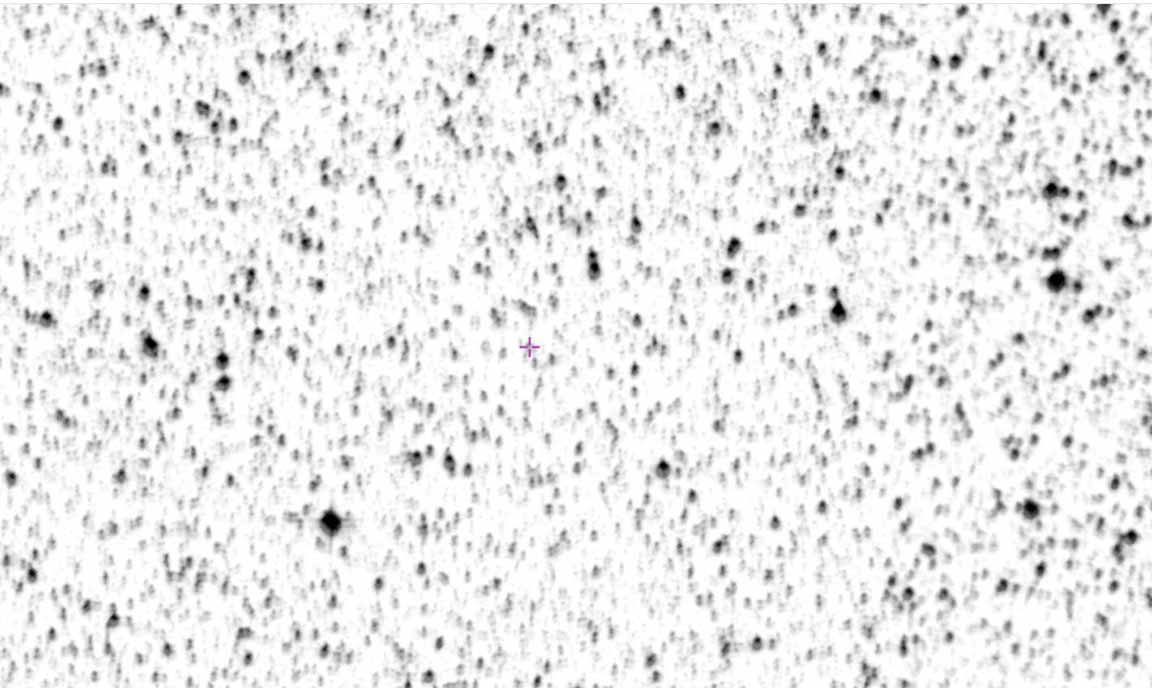
In the charts below, the Alt/Az and RA/Dec orientations are near identical since the target is due south. In addition to the usual 8SE charts, I have a zoomed in on the LCD chart, and I also have the Aladin DSS photograph which actually shows the target and lots of other stars, to help you judge when you have enough integration.
|
|
|
|
|
 |
This was part of a two-fer. This high value but very tough KBO event, and then the easier Hokutosei event. Kirk observed both from the Eco Reserve, and I from the end of PineRidge cul-de-sac. We both got recordings of both events, so far unreduced or uncertain.
 |
 |
 |
 |
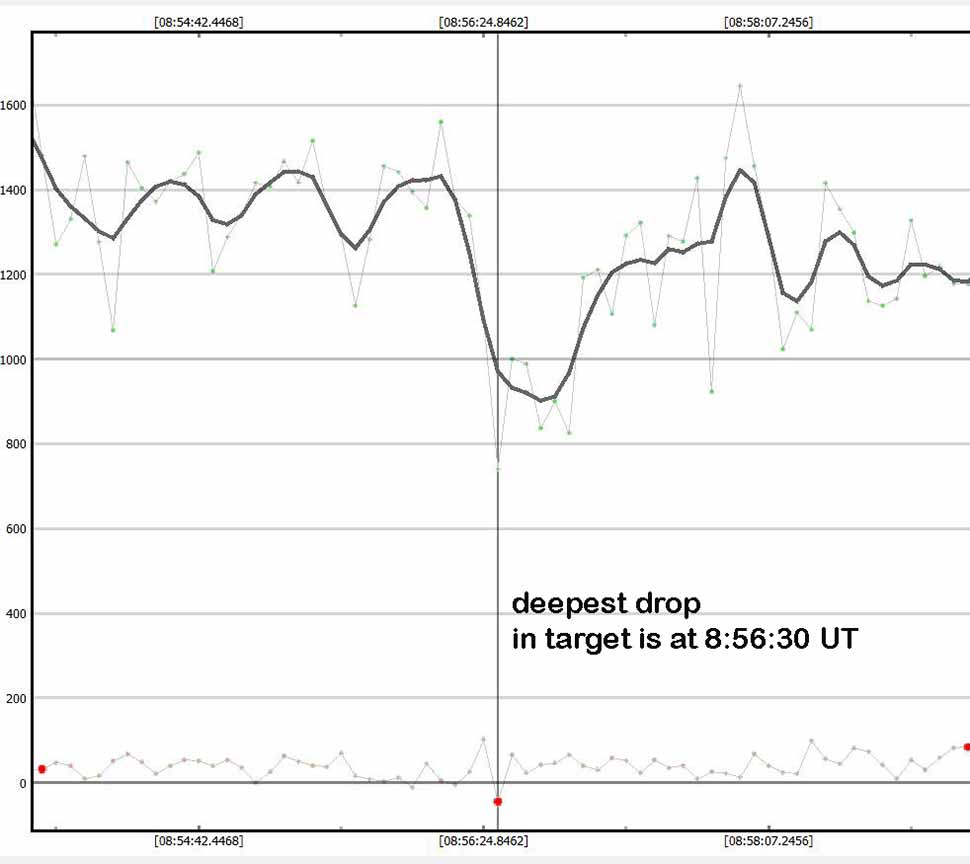 |
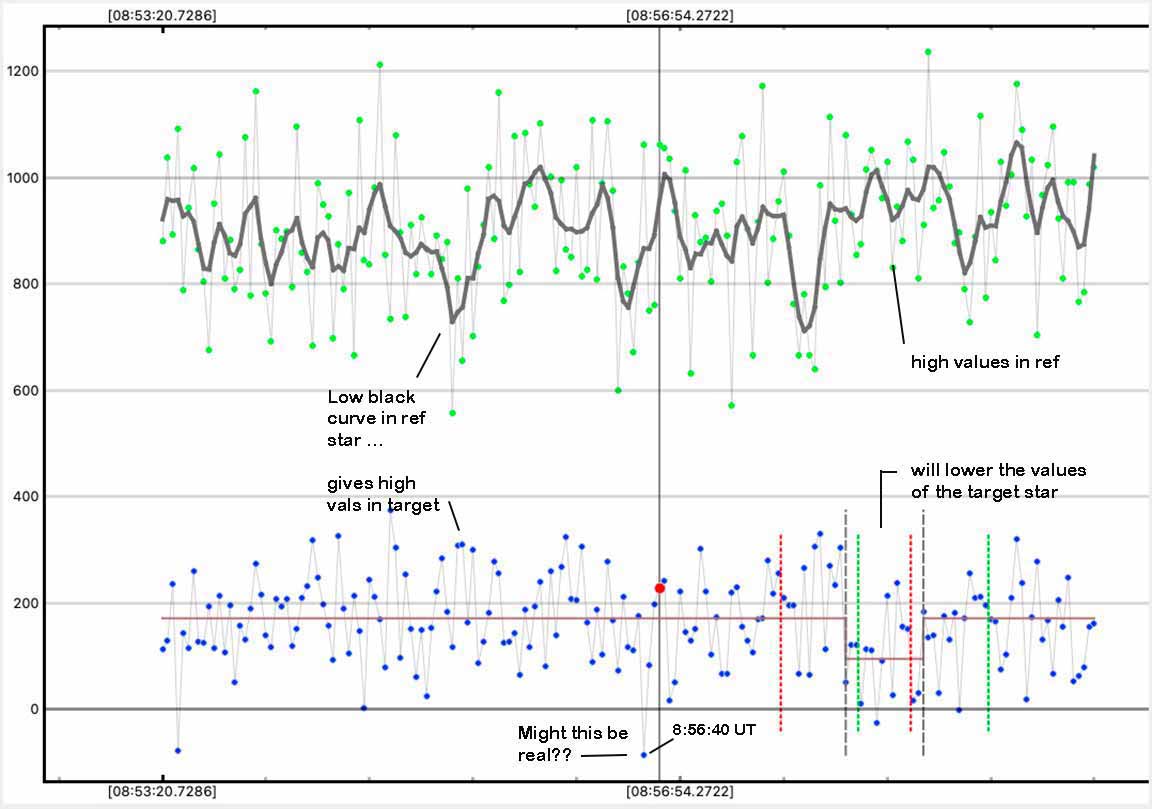
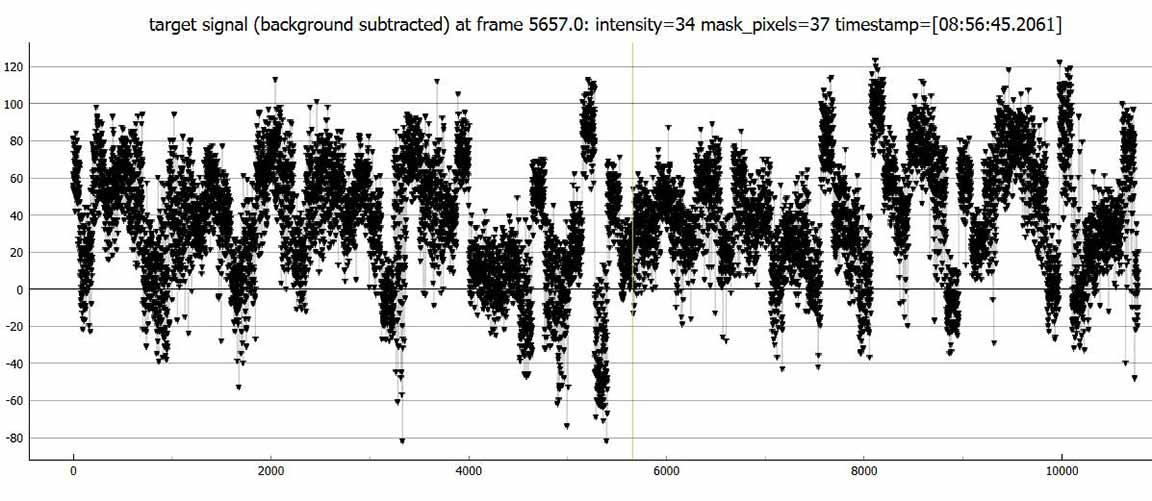
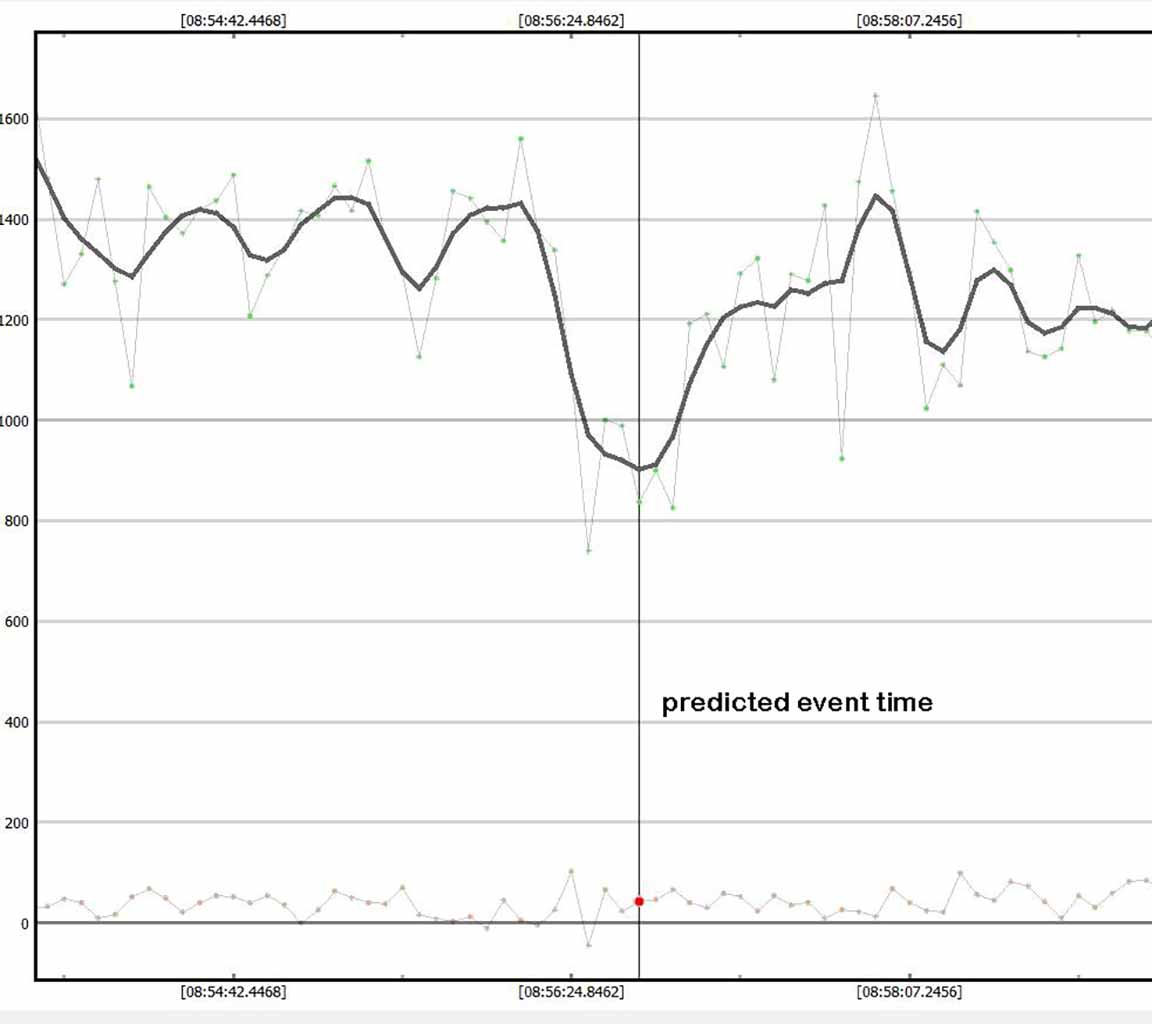
I showed the deepest drop in the record, it's 15s before the predicted time of the central event, but that's within 1-sigma confidence limit. The duration is 5s, as that's the duration of each 256x integration.
My light curves are noisier than Kirk's, but the target was still detected. The deepest drop in the light curve happens 15s before the predicted occultation mid-time, and this is still inside the 1-sigma confidence interval of the mid-time. However, it is only a single point, or a single 5s integration. That time was 8:56:30.0 UT. Kirk also saw his lowest point was before the predicted time, but his was 10s later, at 8:56:39 UT. That's different enough that they are both more likely noise.
I do not have a clear miss, nor a clear hit. It's just too noisy and poor conditions. No IOTA report filed.
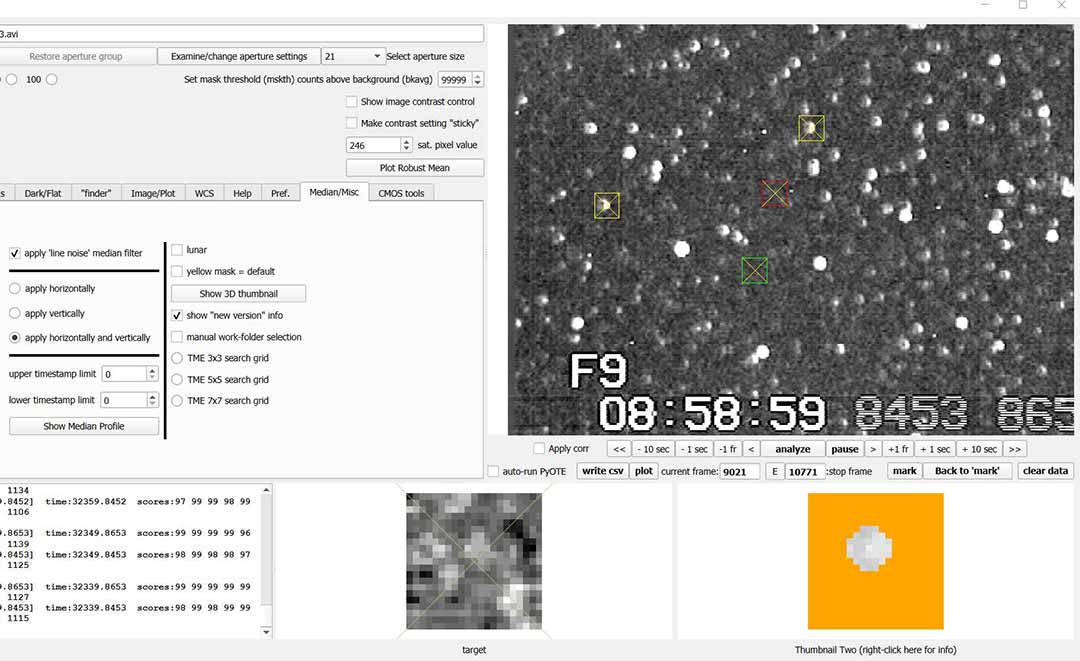
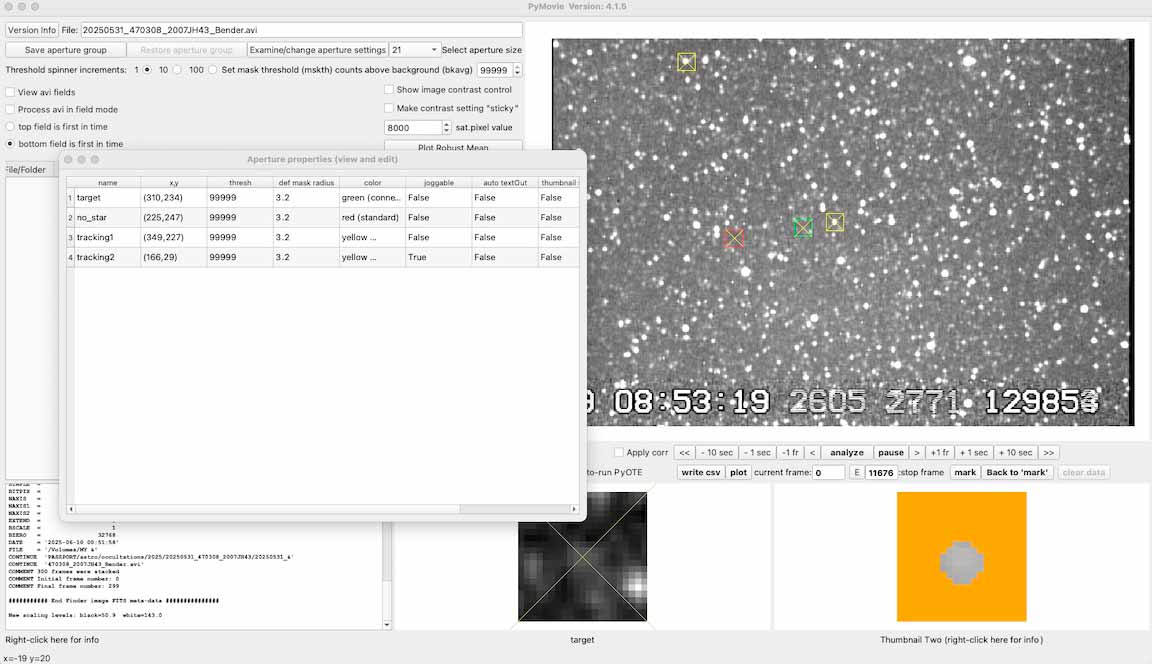
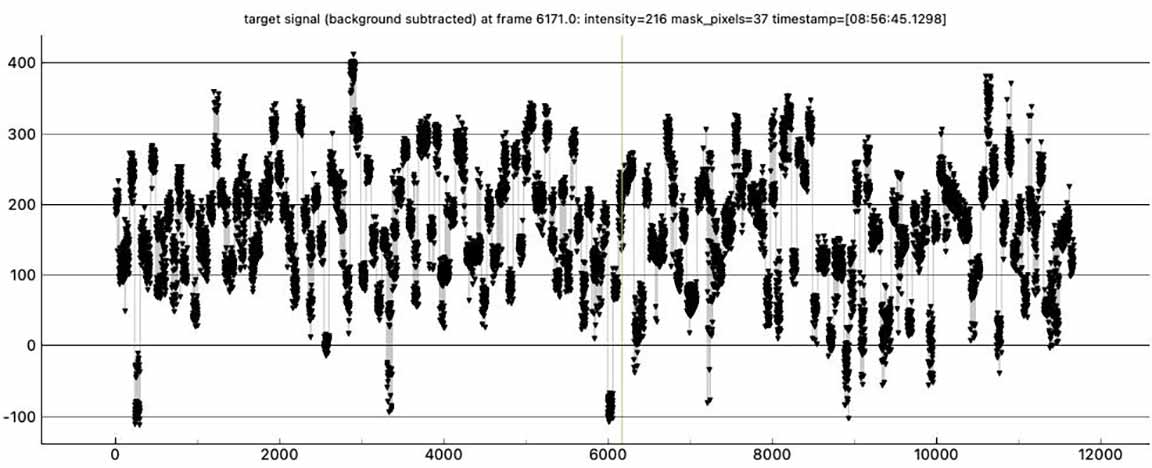
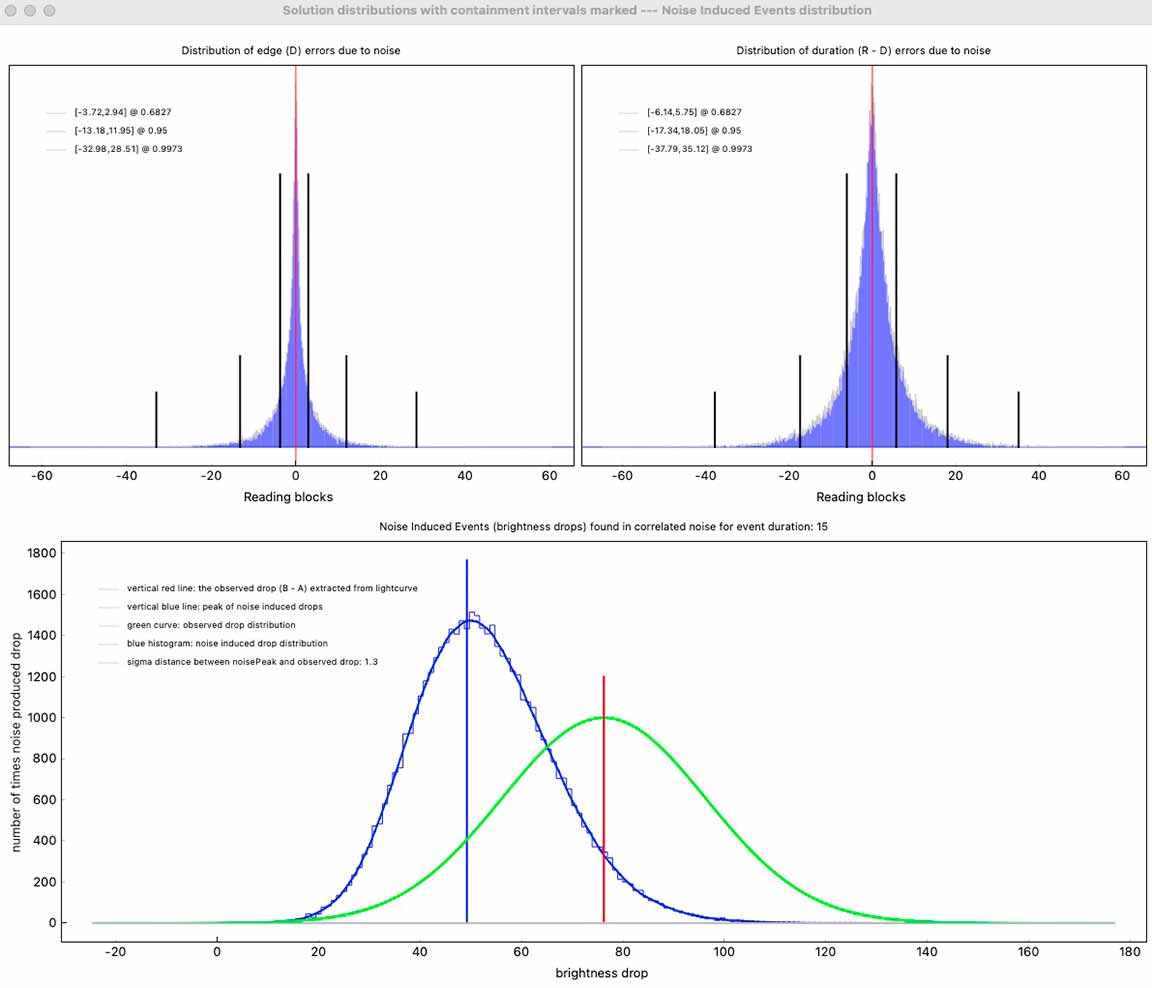
I tried reducing 2007 JH43, the KBO/TNO on May 31, 128x from the BD eco reserve, fortunately I had good tracking and no moon. The field is very crowded, but I tried to place the target aperture as best I could, included is my pymovie finder with an arrow where I think is the target, and a Panstarrs image, which fortunately is the same orientation as my Watec field. I tried different static apertures and the curves were all similar. I recorded for 6.5 minutes, at 128x after pyote block integration there are 180 points. There is a one-integration drop 3 seconds before the predicted time, but there is also a drop as deep near the beginning of the curve, so I don't know if it's real. I had pyote find an event, but it found an event 75 seconds after predicted, and duration 32 seconds, with wide error bars, NIE sigma 1.3, so I doubt that's real. If I trimmed that out, it could not find an event, either with min/max or manual D/R. Pyote detectability tool reports an event as short as 12.85 seconds would be detectable, predicted max was 15.75. I'll send my recording to Lucky Star so they can look at it.
magDrop report: percentDrop: 44.5 magDrop: 0.639 +/- 0.458 (0.95 ci)
DNR: 0.93
D time: [08:58:02.6061]
D: 0.6800 containment intervals: {+/- 7.1153} seconds
D: 0.9500 containment intervals: {+/- 26.8286} seconds
D: 0.9973 containment intervals: {+/- 65.6565} seconds
R time: [08:58:34.6376]
R: 0.6800 containment intervals: {+/- 7.1153} seconds
R: 0.9500 containment intervals: {+/- 26.8286} seconds
R: 0.9973 containment intervals: {+/- 65.6565} seconds
Duration (R - D): 32.0315 seconds
Duration: 0.6800 containment intervals: {+/- 12.6891} seconds
Duration: 0.9500 containment intervals: {+/- 37.7947} seconds
Duration: 0.9973 containment intervals: {+/- 77.8479} seconds
 |
 |
 |
 |
See RN's commentary below on this... |
 |
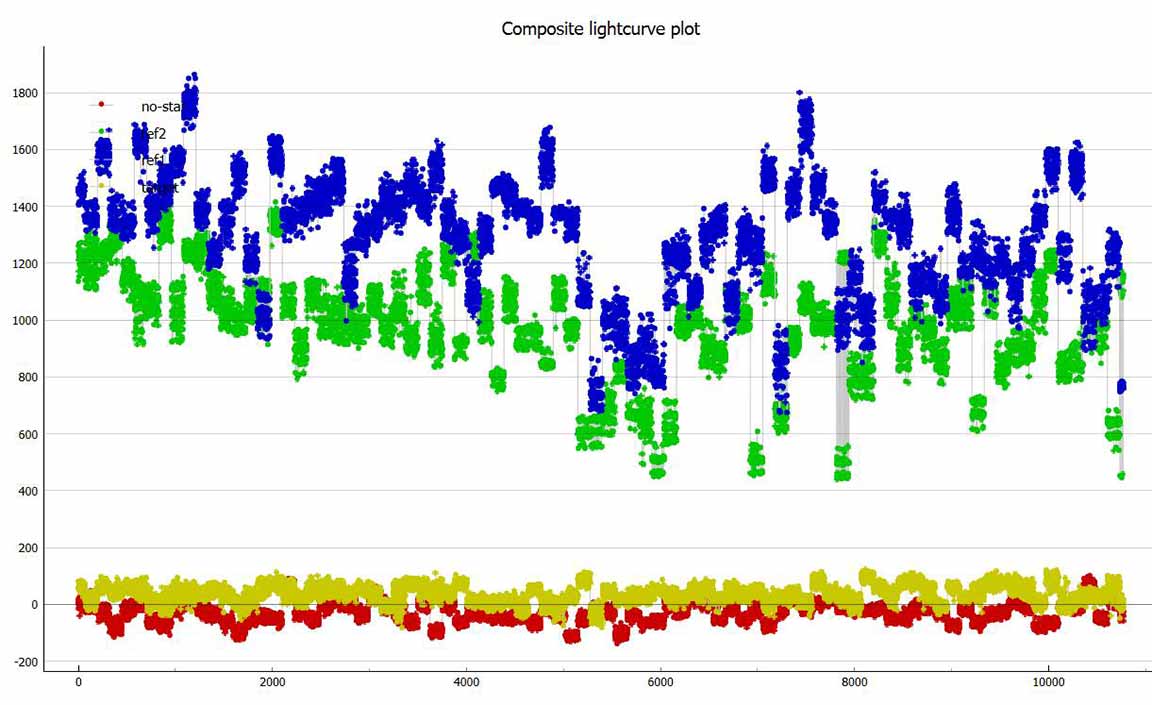
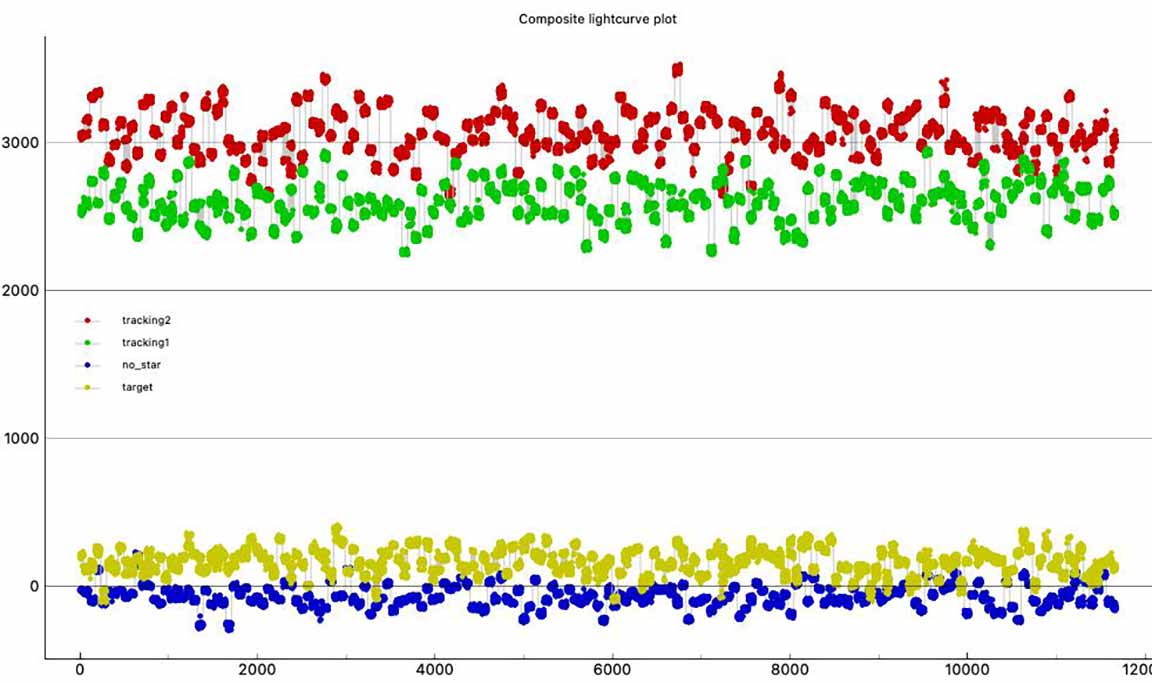
RN: Looking at the PyOTE calibrated curve, here's what I notice... The flatness metric was optimized, it seems, for a fairly short smoothing interval, given the high frequency oscillations in the green ref star curve. The height of the ref black curve will directly and inversely affect the values in the target curve. If you look at the rises and falls, you can indeed see the inverse relation. In particular, I notice the PyOTE-flagged detection corresponds to an extended period of higher values for the ref star. I note too that the low values for the clear dip about 1/3 of the way through the recording interval correspond to unusually high values in the target star, as would be expected. I think the flagged event is then even more likely to be noise and not real. I'd be more interested in the reality of the single zero point in the target star very close to the predicted time, as this can't be attributed to a peak in the black curve. In fact, the black smoothed ref curve is lower than usual around that time, so that the depth of the target at that time would be even stronger if the ref black curve were much smoother.
However, Mike Skrutsie has a solid "Miss", and David Dunham's data is too noisy to make a judgement, as is Vadim Nitinkin's data. I've not yet seen their light curves, though.
My assessment is that most likely Kirk and I had noisy misses, as the two sharp dips differ in time by 9s and that's too long given our close geographic site positions. And, the light curves have too much noise.